
“Premature optimization is the root of all evil (or at least most of it) in programming.” – Donald Knuth
As the famous computer scientist is suggesting, wait until your app is actually working before you start thinking about performance improvements. But once you have your project working as expected, you can easily analyze its performance using the Xojo Profiler.
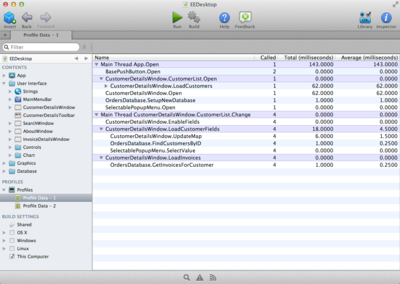
The Profiler tracks the length of time each method in your application takes to run. With this information, you can best determine the parts of your app that could use optimization.
Using the Profiler
You can enable or disable the Profiler using the Project â Profile Code menu. A check mark appears next to the menu when profiling is enabled.
Once you enable profiling, just run and test your project as you normally would. The Profiler will silently gather information for you and display the results when you quit your app.
This information appears in the Profiles section of the Navigator.
You can save the profiler data to a text file using the contextual menu. Simply right-click anywhere in the summary and choose “Save As…”.
As you are optimizing your application, you can compare the current Profiler Data with previous Profiler Data to see if your changes are improving performance.
For more information about the Xojo Profiler, refer to *User Guide Book 3: Framework, Chapter 8: Debugging, Section 5: Profiling for Performance*.