
With many things in life, more choices means more freedom of expression. We can pick and choose what we like personally as a way to express ourselves. Such is the world on Linux. The myriad of different Linux distros along with all the different Desktop managers and Window managers available are daunting. While more choices is nice (in general anyway), it can also cause more confusion. As a cross-platform developer, you’re probably aware that every operating system has their own way of dealing with crashes and crash reports. On Linux this is no different, but it is more confusing because not every Linux distro plays by the same configuration. This blog will answer some fundamental questions you may have about what happens when your application crashes on Linux.
What does it mean to “core dump”?
Whenever an application crashes (and I don’t mean crashing with a Xojo Exception, for example), the operating system can store (or even send) a crash report. On macOS a nice crash reporter dialog shows up and you can even view the details of the crash report and get a sample of the stack trace. On Windows you may receive a similar such dialog, with a button to send the report to Microsoft. This crash report will show up in our Windows Error Reporting dashboard that we have setup with Microsoft, so please do hit that button when you can, it will help us out a lot. On Linux, whenever an app crashes (most commonly by a segmentation fault, i.e. when accessing a bad pointer/memory), it has the option of generating a core dump. In most cases though, this core dump generation is disabled by default.
So what is a core dump and what information does it contain?
Just like the crash report you see on macOS or the crash report you send us from a Windows crash, it’s a file which contains the program’s running state at the point of the crash. It also contains a snapshot of all the virtual memory areas accessed by your app, so yes, there can be confidential information stored in a core dump so be careful who you give it to.
How does one enable the core dump to be generated, and where can I find this file?
This actually depends on your Linux distro/configuration. For purposes of keeping this brief, I will detail the most common steps with links to read further if desired. Let’s assume we’re on a Linux distro that has a running Terminal using bash (for example, Ubuntu distros running Gnome desktop manager). To start, we need to tell the system how big of a core dump to allow. To do this, type the following line in your Terminal:
ulimit -c unlimited
By default, this value is 0, which is why the core dump is never generated. Executing the above line in a bash Terminal will allow the core dump to be generated for that Terminal session. The “unlimited” parameter tells the system not to restrict the size of the core dump file. Now assume you have an application that does crash, run that application in your Terminal session and wait for it to crash. Here’s a very simple example that generates a core dump. I’m on a 64-bit Ubuntu distro and I have failed to install the 32-bit ICU libraries:
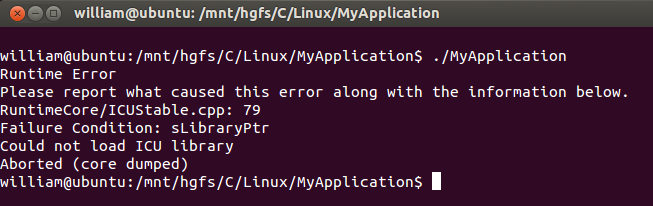
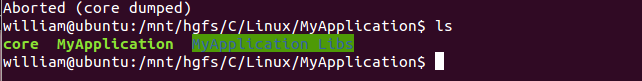
After this terminates, you should see a “core” file generated in your current directory (however, depending on your configuration this may be located elsewhere).
Now that you have the core file, you can send this to the developer and he can debug it using gdb. Assuming the developer has access to the debug symbols (or can build the offending crashing app/lib with debug symbols), he/she can gather a fairly decent stack trace to figure out what the issue is. If you’re even slightly curious as to the stack trace, you could even debug this yourself if you know what the offending app/lib that crashed is. In our simple example, I know the crash occurs in XojoConsoleFramework32.so, so I would run gdb like this on the core file:
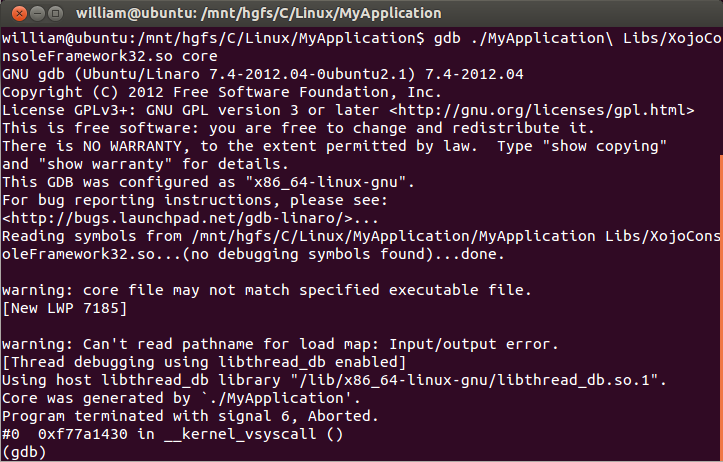
Now that the core file is loaded in gdb, you can proceed to perform a backtrace:
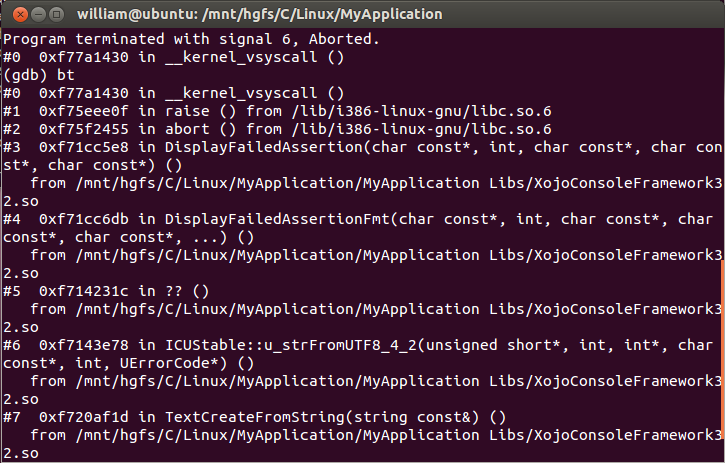
Note that gdb doesn’t load any debug info from our framework library since we don’t build release frameworks with debug info in them. We do however, store these debug info files locally and use them for purposes of debugging core dumps. So the core file itself, along with the right debug information, is extremely useful to have in debugging the crash. If your Linux app ever crashes, now you know how to generate a core dump, where to find it, and hopefully you’ll be able to send it to the developer(s) so that they can debug it.
Here are some additional resources for further investigation, depending on your needs/distro.
How to apply ulimit globally instead of in our terminal session:
http://serverfault.com/questions/292237/apply-ulimit-globally-on-ubuntu
How to generate core dumps for different shells (like tcsh) and different ways to generate the dump:
http://stackoverflow.com/questions/17965/generate-a-core-dump-in-linux
How to find your core dump file:
http://stackoverflow.com/questions/2065912/core-dumped-but-core-file-is-not-in-current-directory
Debugging without executable:
https://sourceware.org/ml/archer/2008-q4/msg00119.html
Have more questions about this? Ask me here or on the Xojo Forums.
Visit some of my other posts: Control Sizes on Linux, Linux and Overlay Scrollbars, and Linux, LiblCU and Xojo 2015r2. Want to learn more about using Xojo on Linux or ask your own questions?