
Most of us build apps without thinking too much about how much memory the app will need. Sure sometimes you end up creating an app that is a real memory buster but that’s unusual. With virtual memory, gone are the days when your app would just run out of memory and crash, or are they?
Client apps for the desktop and mobile are pretty straight-forward in terms of both determining how much memory they will use and testing the app since only one person uses the app at a time. Even if the app does run out of memory, it only affects one user. When building web apps, web services or really just about any app that’s going to run on a server in the cloud or otherwise, the risk is far greater. If the app crashes, every user is potentially affected. Determining the memory needed is more difficult as well. The primary reason is that you will have potentially many users accessing the app at the same time and each using varying amounts of memory. The situation is made worse by the fact that most modern operating systems no longer manage memory behind the scenes in the same simplistic way they once did.
Getting on TOP of It
The most common server operating system is of course Linux and the tool of choice for knowing how your apps are behaving is the UNIX app know as TOP. TOP provides a lot of interesting though potentially confusing and even misleading information.

Here TOP is showing us information about the server in general such as the average load, the number of tasks, how busy the CPU is, how much memory the server has and how much is available, etc. Below that, TOP breaks down information about each process, some of which are apps while others (in this case) are connections to an app. The first three processes in this case are web apps. The most important columns are VIRT, RES and %CPU.
VIRT (Virtual Memory) indicates how much virtual memory the app is using for data. For example, the EEWeb-Dev app is using 81504K (81.5Mb). This value will go up and down as your app uses more or less memory for data.
RES (Resident Memory) indicates phyiscal memory used by the app/process.
%CPU indicates how much of the CPU the app is using at this moment. It’s not unusual for a web app to occasionally use a lot of CPU and then a moment later use very little.
Note: Different Linux distributions display VIRT and RES differently. CentOS, for example, displays these values in K unless there’s not enough room. So 81504 is 81.5 Megabytes. 41m is 41 Megabytes. To determine how much memory your app is using, you’d add VIRT and RES together.
Considering all the information available, you’d think it would be easy enough to determine how much memory your app is using. After all, TOP shows you how much memory is free. Isn’t that enough? Unfortunately, it’s not that simple. You might think that as soon as your app stops using memory (for a user connection for example) that it’s instantly free and available for other apps to use. Nothing could be further from the truth. The OS has a lot of priorities only one of which is dealing with memory that has suddenly become available. Like you, it prioritizes based upon need. If there’s plenty of free memory already, it may not bother cleaning up memory freed by your apps for some time. If another app suddenly needs a lot of memory and the free memory won’t suffice, the OS will immediately kick in and collect all the freed memory from various apps. However, if nothing puts pressure on the OS to do this, it could be anywhere from a few seconds to more than an hour before the OS cleans memory up. This means simply monitoring TOP for a few minutes isn’t going to be enough.
If you’re using Xojo Cloud you don’t have to worry about any of this. Starting with Xojo 2018 Release 1, Xojo has built-in server statistics that you can easily display to show CPU, memory, network and disk statistics for the entire server and individual apps.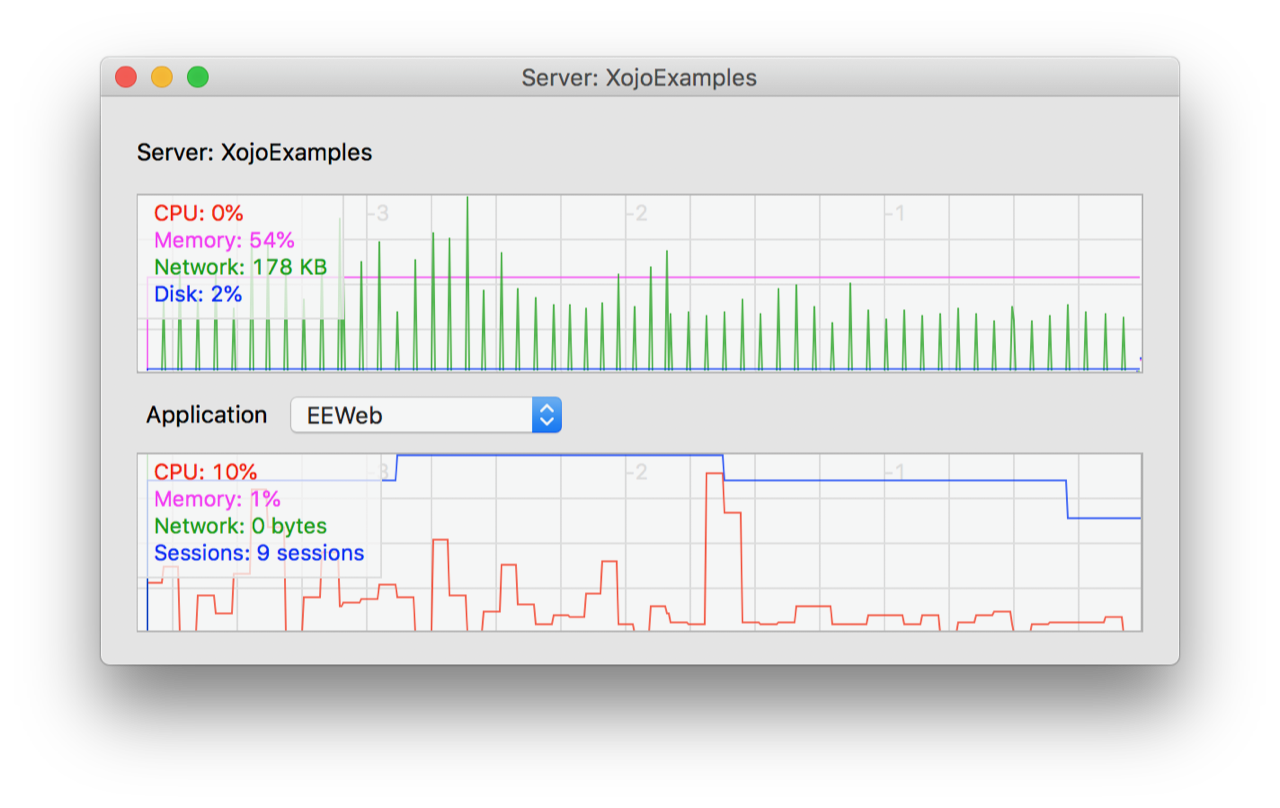
Leaking Memory
If you have the kind of app that gets used only during specific hours, you could take a look at memory usage before everyone starts using it, again when everyone is working and finally an hour after they finish. Unless your app is designed to hold on to information in memory even after users have shut down for the day, the memory available should have returned to approximately what they were when you started. If your app is still using a lot of memory long after all your users have quit, you’ve probably got a memory leak.
A memory leak occurs when memory is allocated for something but then never released. If a leaking function is called over and over, the amount of memory being used continues to climb potentially until there’s none left and the application crashes. The most common reason for this is your code has created some kind of data object and stored a reference to it somewhere but the reference never goes out of scope. Say you’re storing the reference in some global part of your application code. Unless something clears the reference, the memory will continue to be used indefinitely.

How Much Memory do I Need?
If your app or apps are behaving themselves, the memory used goes up and comes back down later on. In that case, the question is, how much total memory do you really need? In computing, we are used to very black and white answers. In this case, the answer is not so satisfying. If your server runs out of memory, the client is going to get disconnected and ideally, provided an appropriate error message. Web apps made in Xojo for example, display such a message to the end user indicating that an Out of Memory Exception has occurred. In this case, when a user reports this to you, you’ll need to determine if your app is leaking memory or simply needs more of it. Now, you’re probably thinking, “Is there any way for my app to know that it’s about to run out of memory?” Not really. It’s using memory from a pool available to all apps. Even if your app could monitor how much memory is free, it doesn’t know if other apps or the OS itself are about to make more available. Once the Out of Memory Exception (or the equivalent error message in the language you are using) occurs, there’s usually not enough memory left to confidentially do anything but crash.
The good news is that there’s a relatively painless remedy. Memory is cheap. If you have your own server, buying more RAM is an inexpensive solution. It’s probably worth buying a lot more than you think you will need. It’s the lowest cost insurance policy you will ever buy. If you are using a cloud hosting solution (like Xojo Cloud for example), then getting more memory involves upgrading your server. In the case of Xojo Cloud and most cloud-based solutions, this is very simple, usually involving shutting down the server for a few minutes then bringing it back up again with more memory allocated.
The Solution: Trial and Error
The best preemptive measure is to find your app’s memory high-water mark. Monitor the memory when usage peaks, ideally over several hours, to see how close you are getting to running out of memory. This will at least give you some rough sense for your situation allowing you to remedy it before your users crash the app and cause a lot of headaches for each other and for you.
Determining how much memory your app needs, at least for most people, is a question of trial and error. This is because operating systems don’t free up memory instantly making it difficult to judge how much memory the app is really using at any given moment. The good news is that despite this, adding more RAM to a server is cheap and easy.
![]()