
Since we are all good programmers we never make mistakes, right ? 🙂
But for those times when you write some code and you just can’t figure out why its not behaving, there is always the Debugger!
The best part is the Debugger is very easy to use and it can help you sort out a lot of common issues. Its covered in the Xojo User’s Guide, specifically see the Using the Debugger section.
Let’s suppose you have an application and you have some code in the action event of a button that is giving you trouble. Open that event handler:
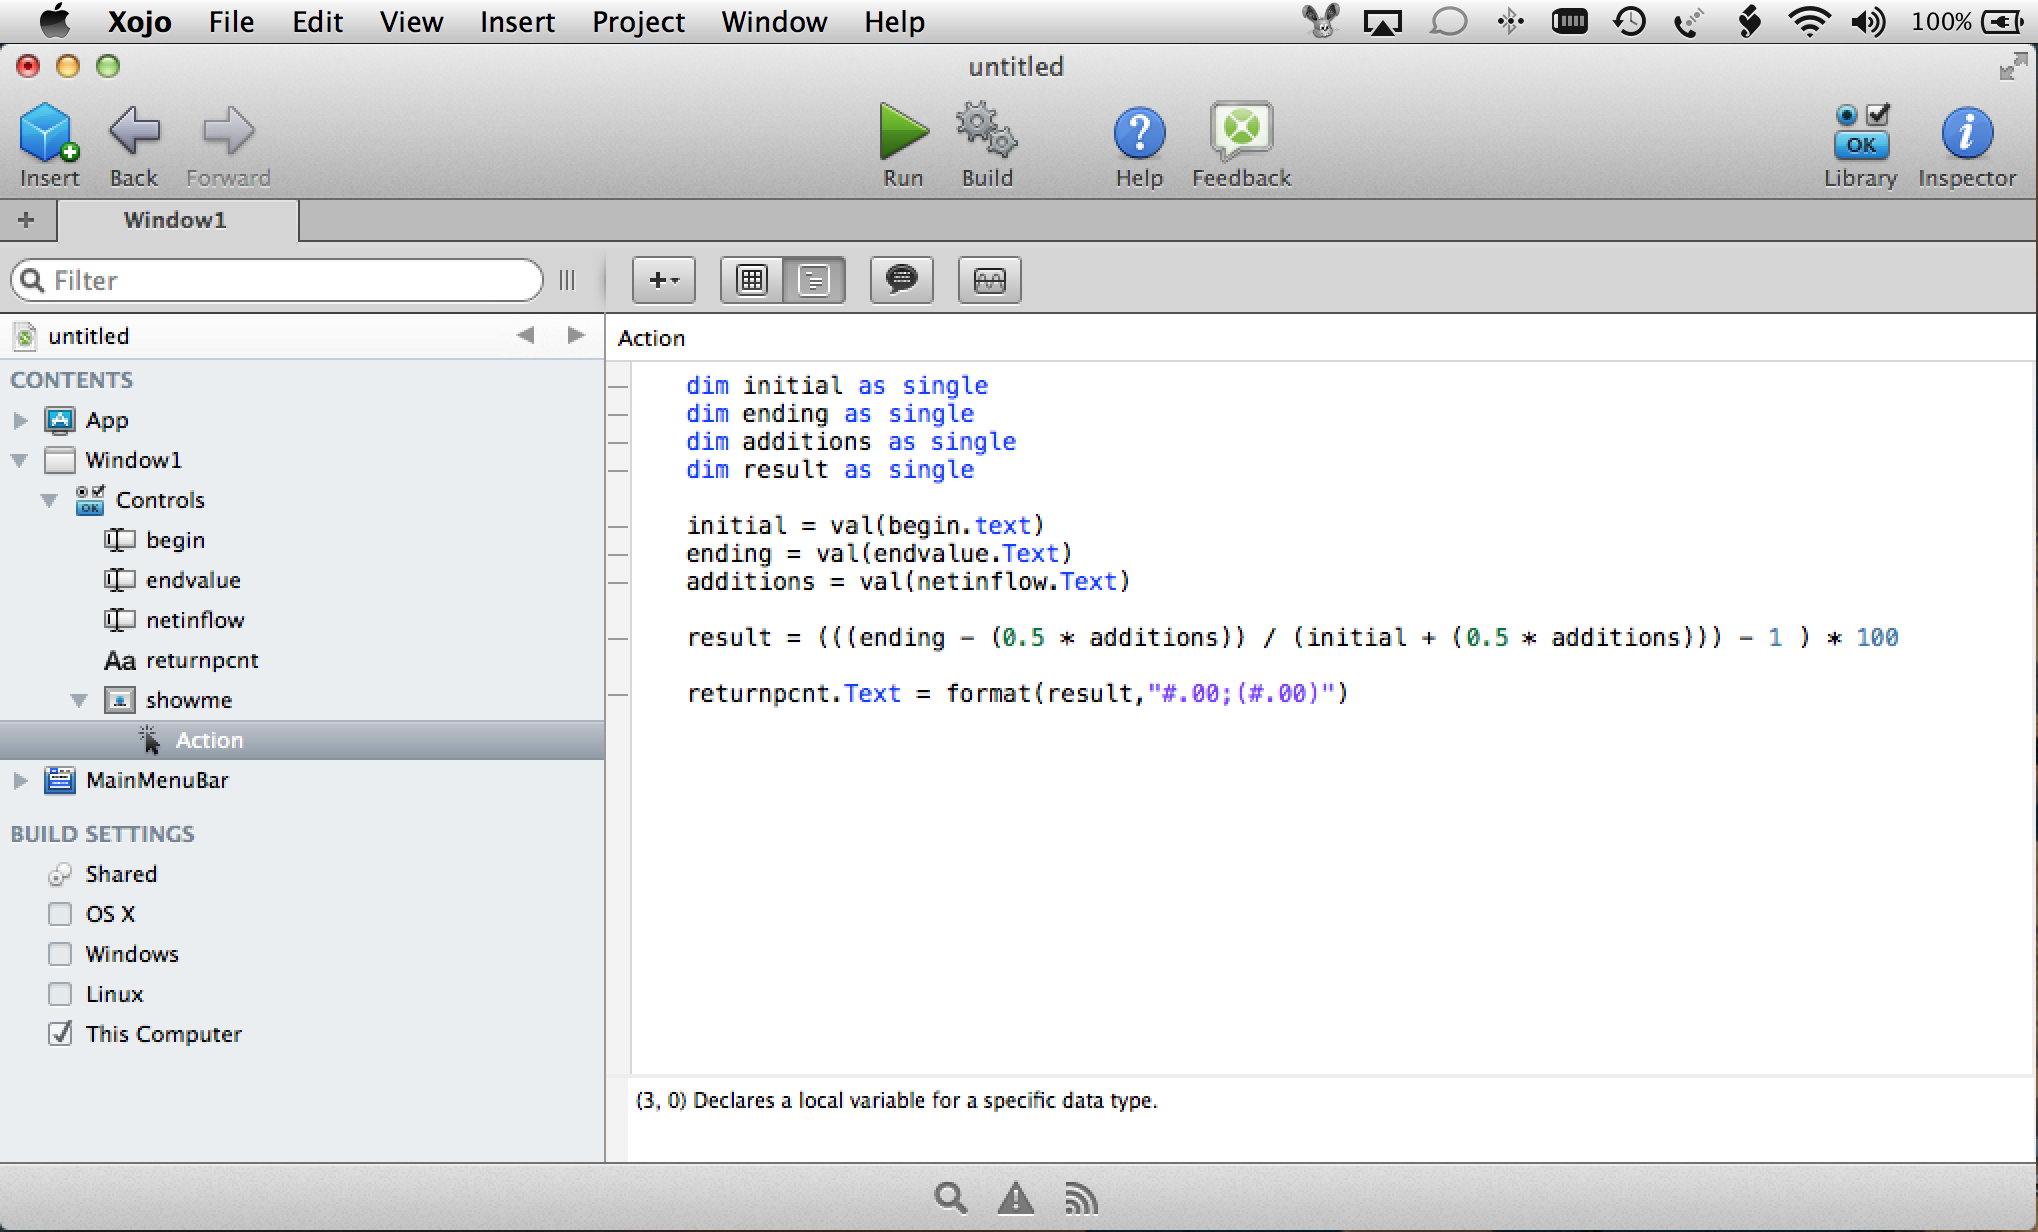
Now, set a breakpoint or a spot where your code will stop.
To do this, click in the left hand gutter on the dash or put the insertion point on the line you want a break point on and select Project > Breakpoint > Turn On.
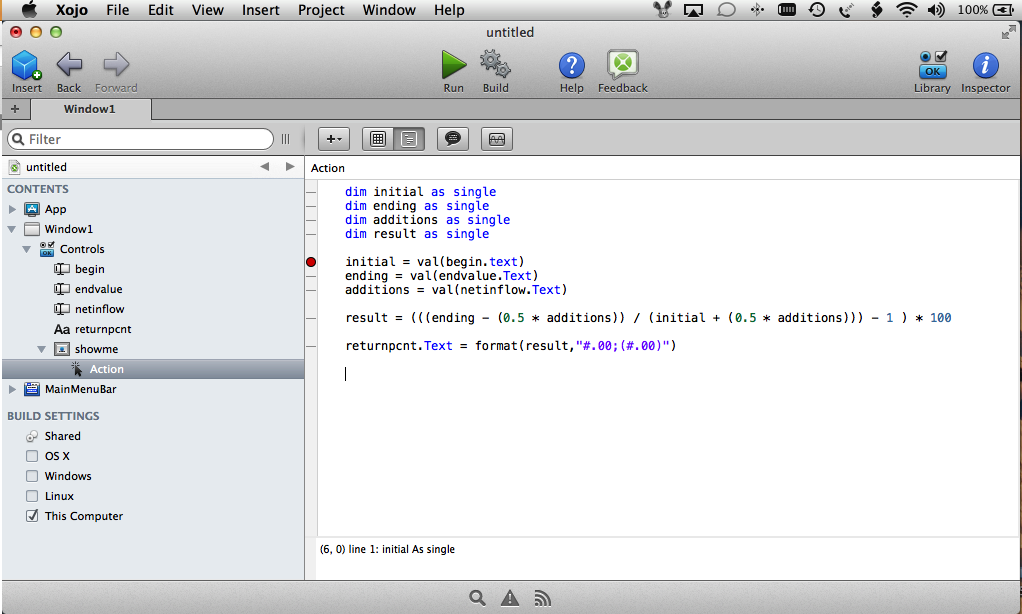
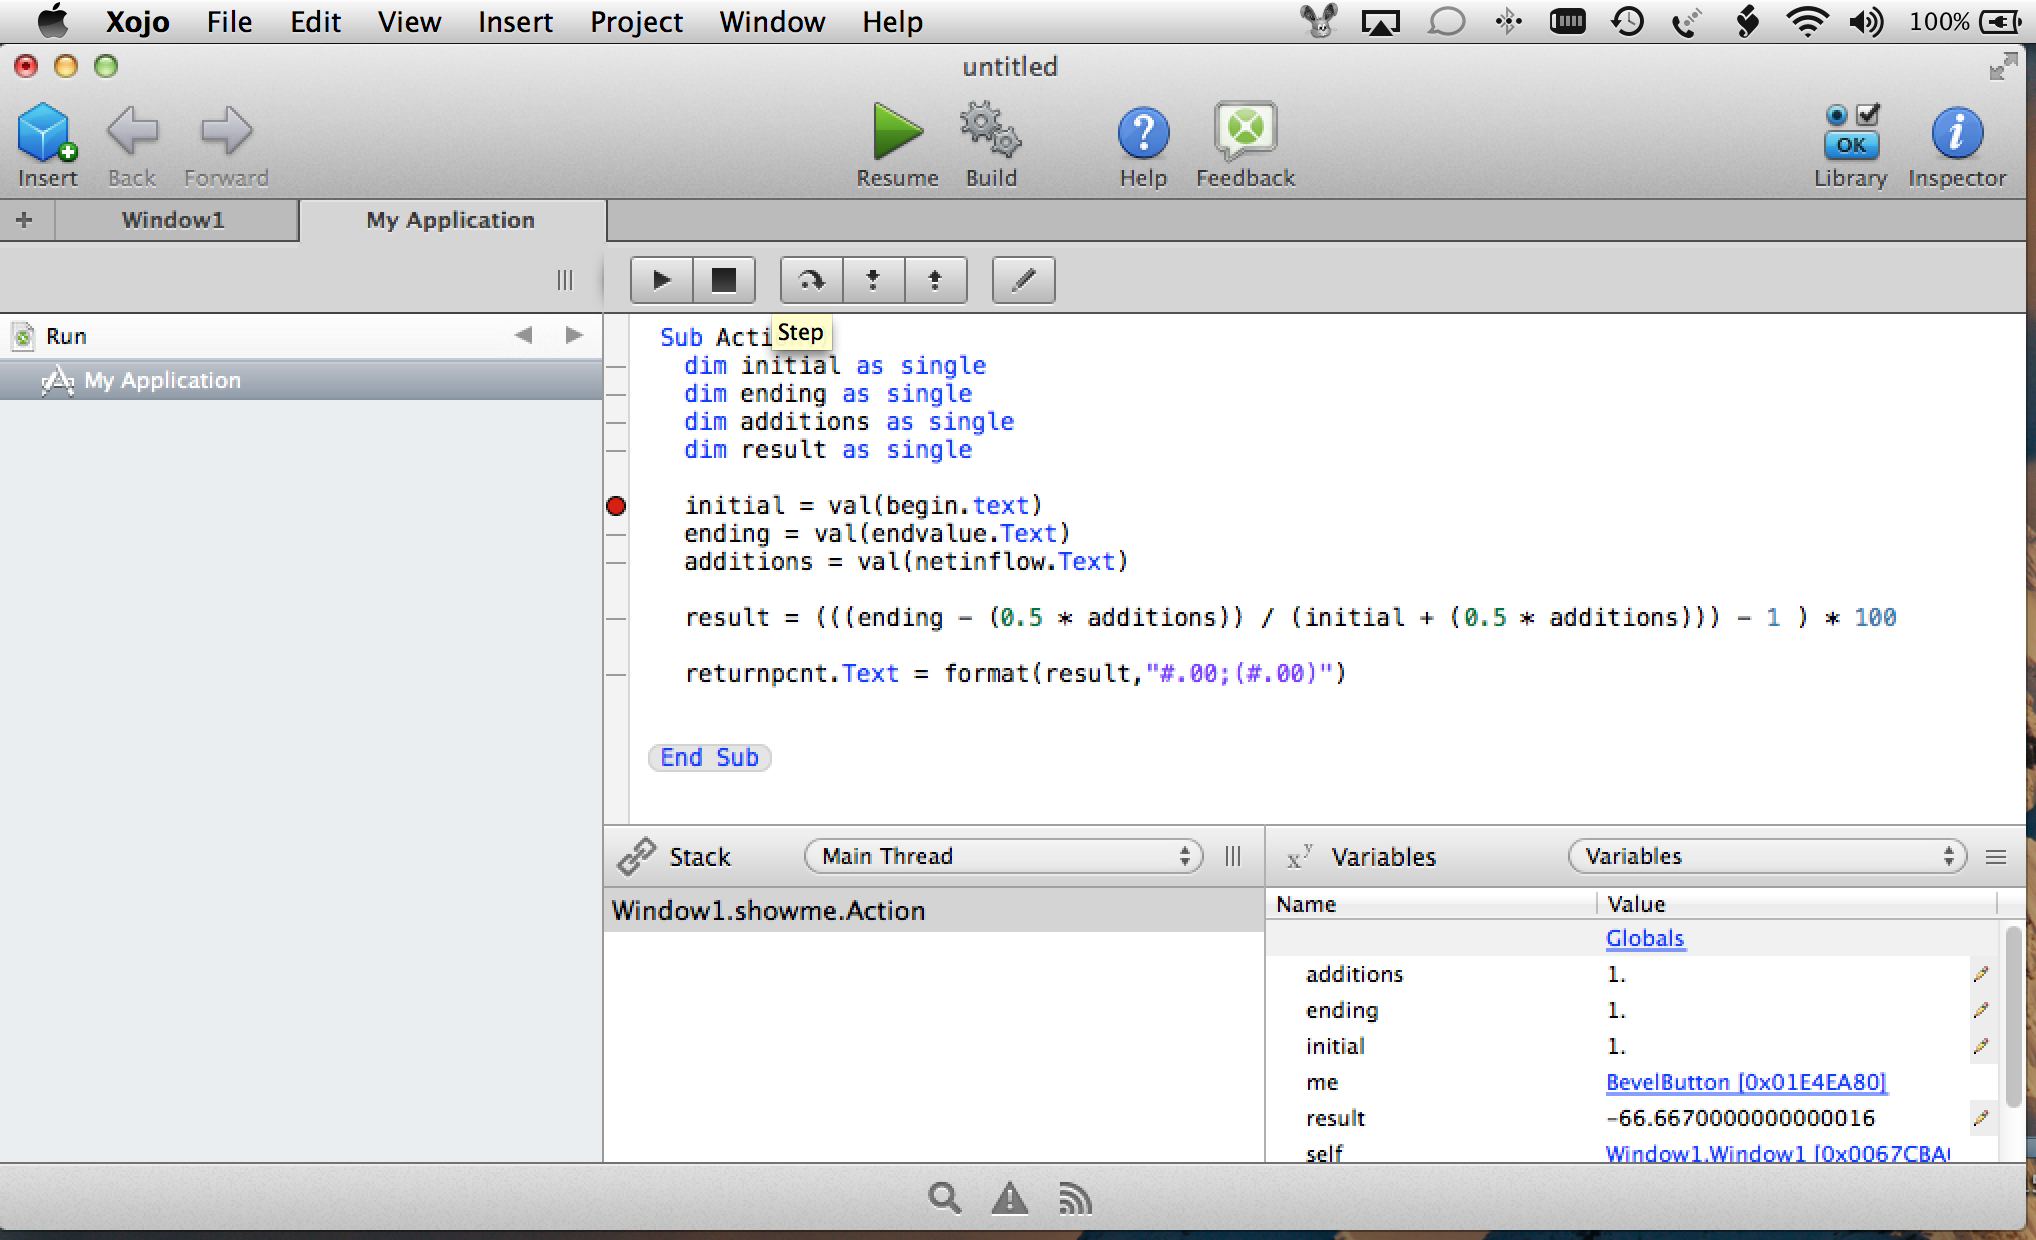
The red dot indicates you have an active breakpoint on this line.
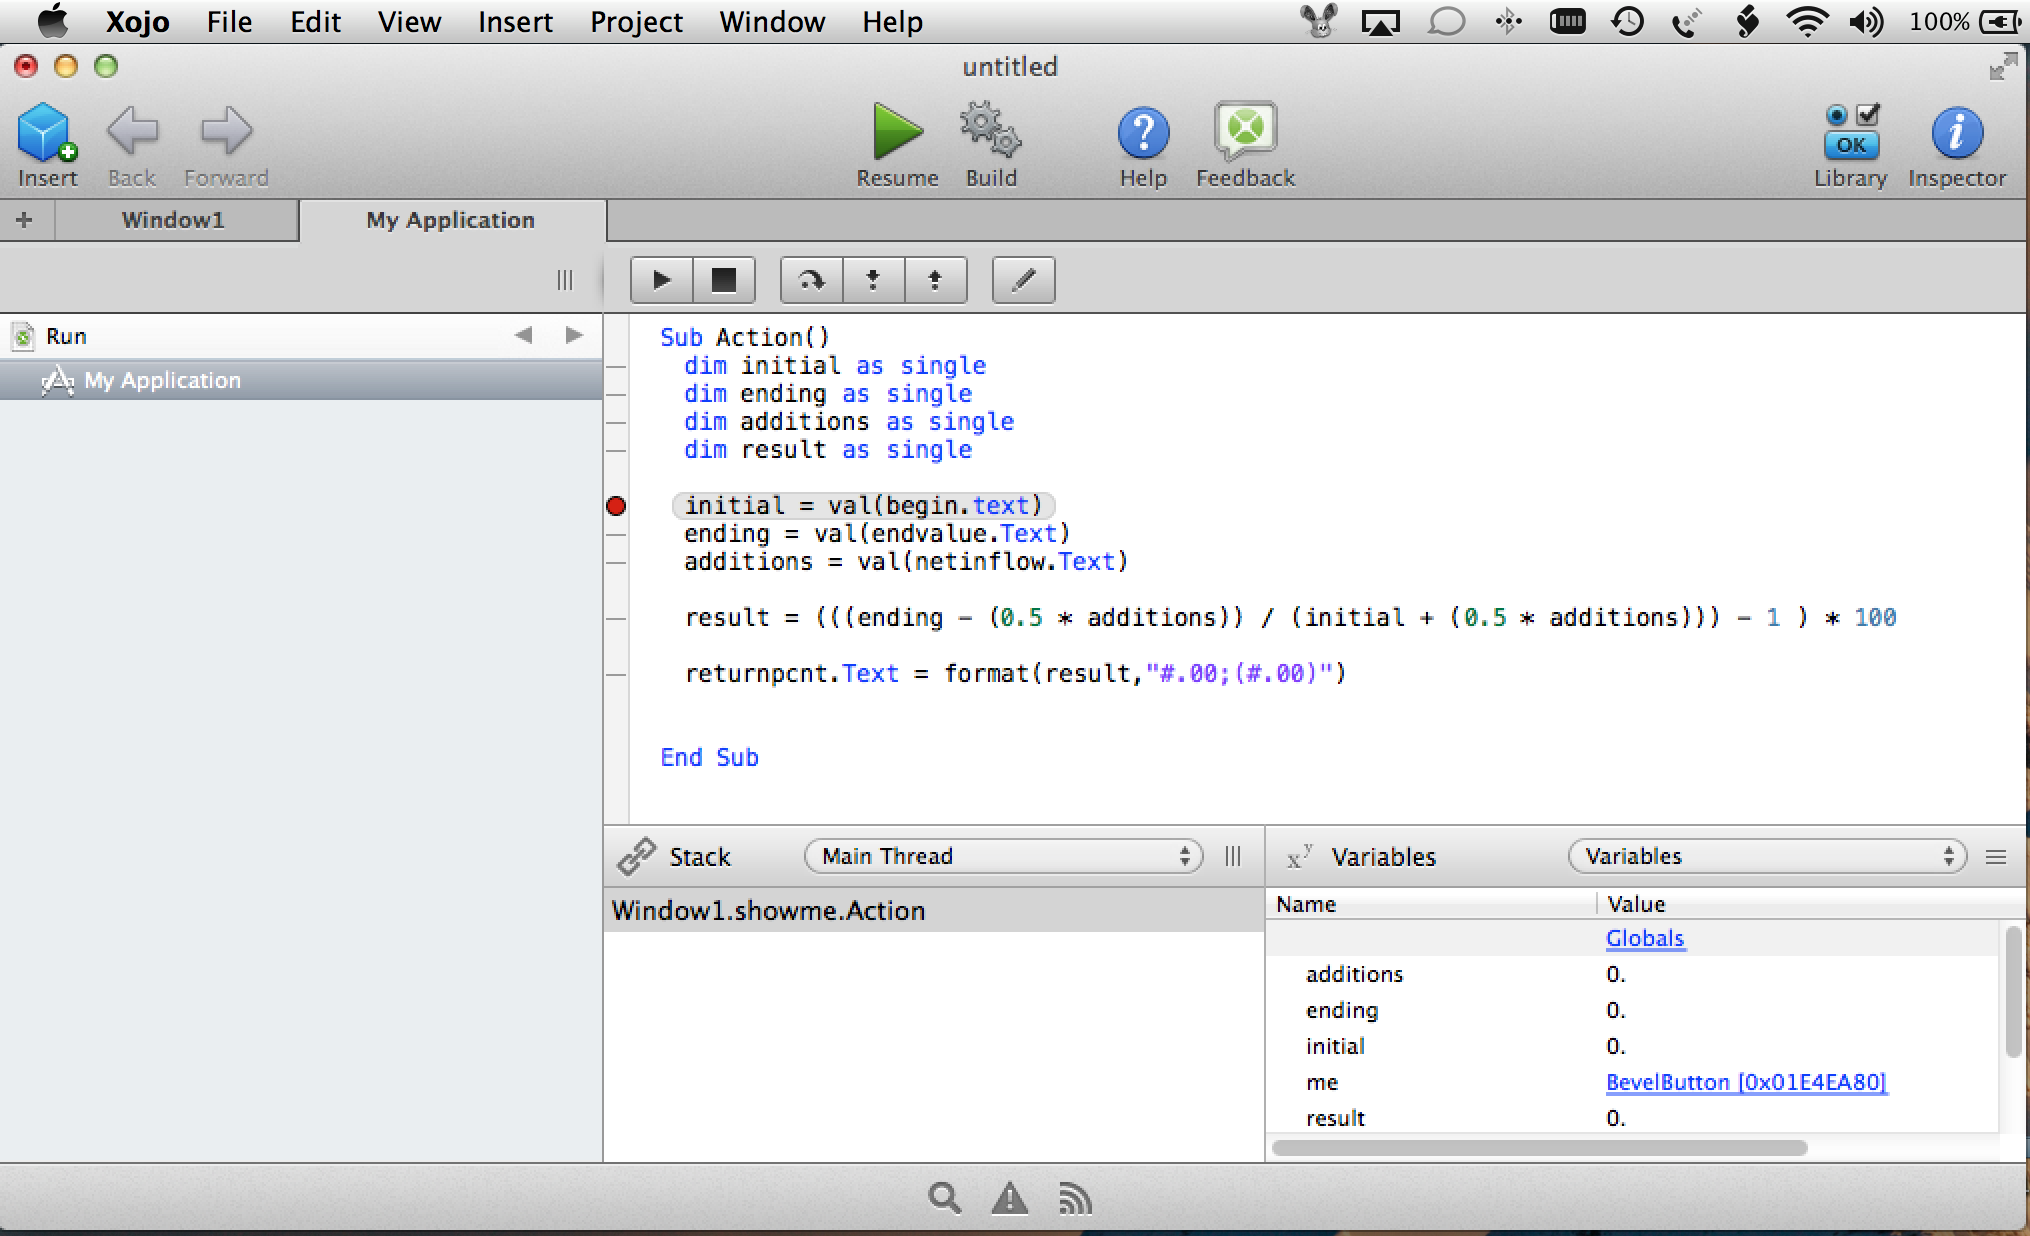
Now, when you run your application and press the button the code will execute and stop on the line marked. Note that it stops on this line BEFORE executing the line.
Now each time you press the Step button 
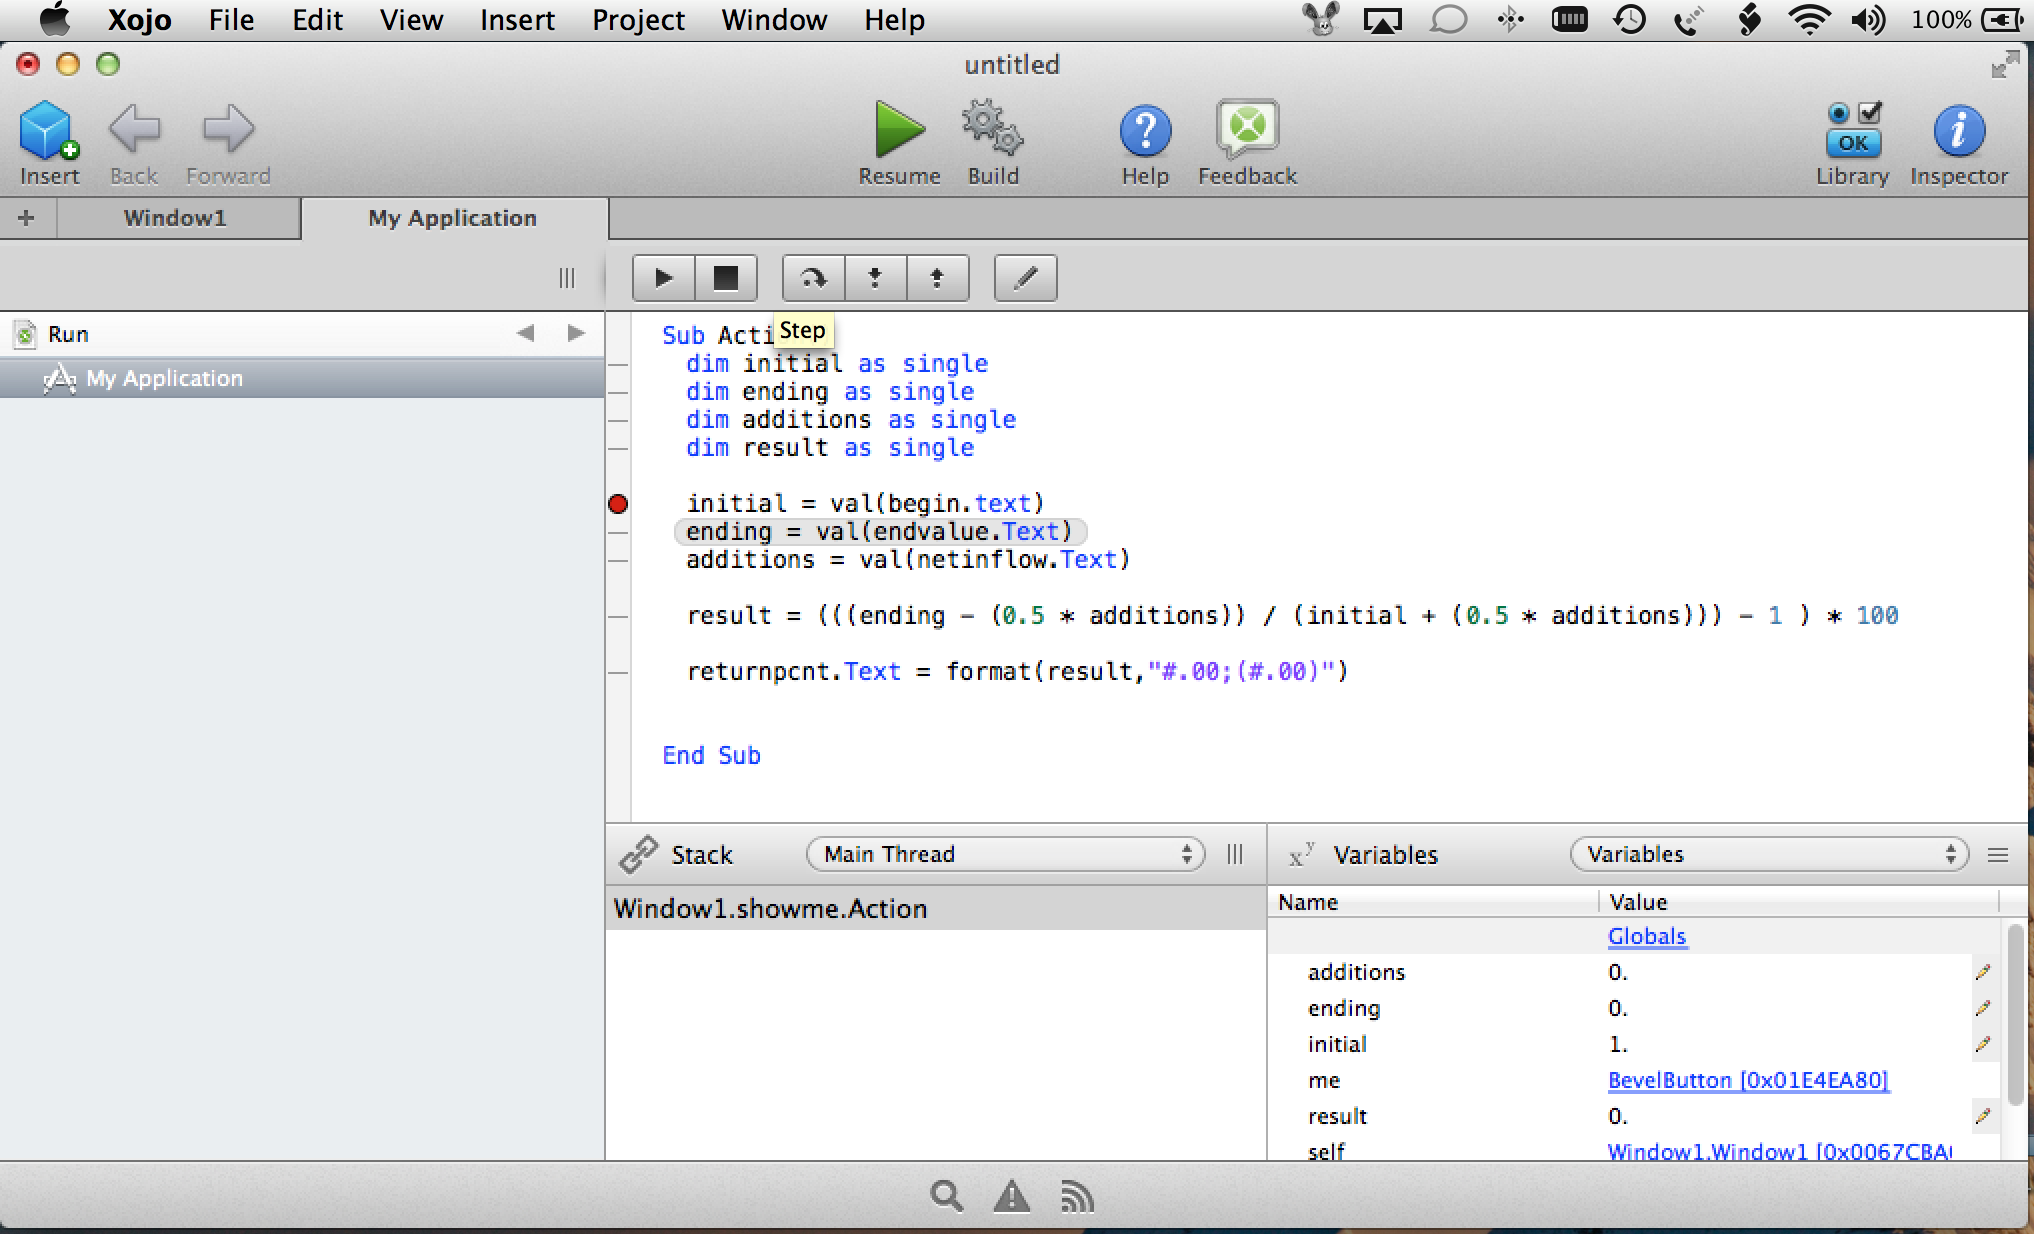
And at each step you can see the values of the variables in the lower right hand variable viewer pane. If your calculation is having problems, you can step through it line by line and examine the values to see where things have gone awry.
Now you might think all this is well and good but there is no line after the one that sets returnpcnt.Text. What is the debugger going to do in that case? Well if you press step you’ll see that the debugger stops BEFORE exiting your code so you can indeed examine the values from the last line of code just as easily.
Learn to use the debugger. It will make life a whole lot easier for you. Of course in a short blog post I can only cover so much so visit the Xojo Dev Center to learn more.
Have fun.