
A user recently asked whether it’s possible to connect the (x, y) points in a Scatter chart using DesktopChart, and if so, how to do it. The short answer is yes, it is possible. Read on and I’ll show you just how easy it is.
For this example, we’ll use the x and y coordinate values of the sine and cosine functions as the data for our scatter DataSets. Go ahead and create a new Desktop project in the Xojo IDE.
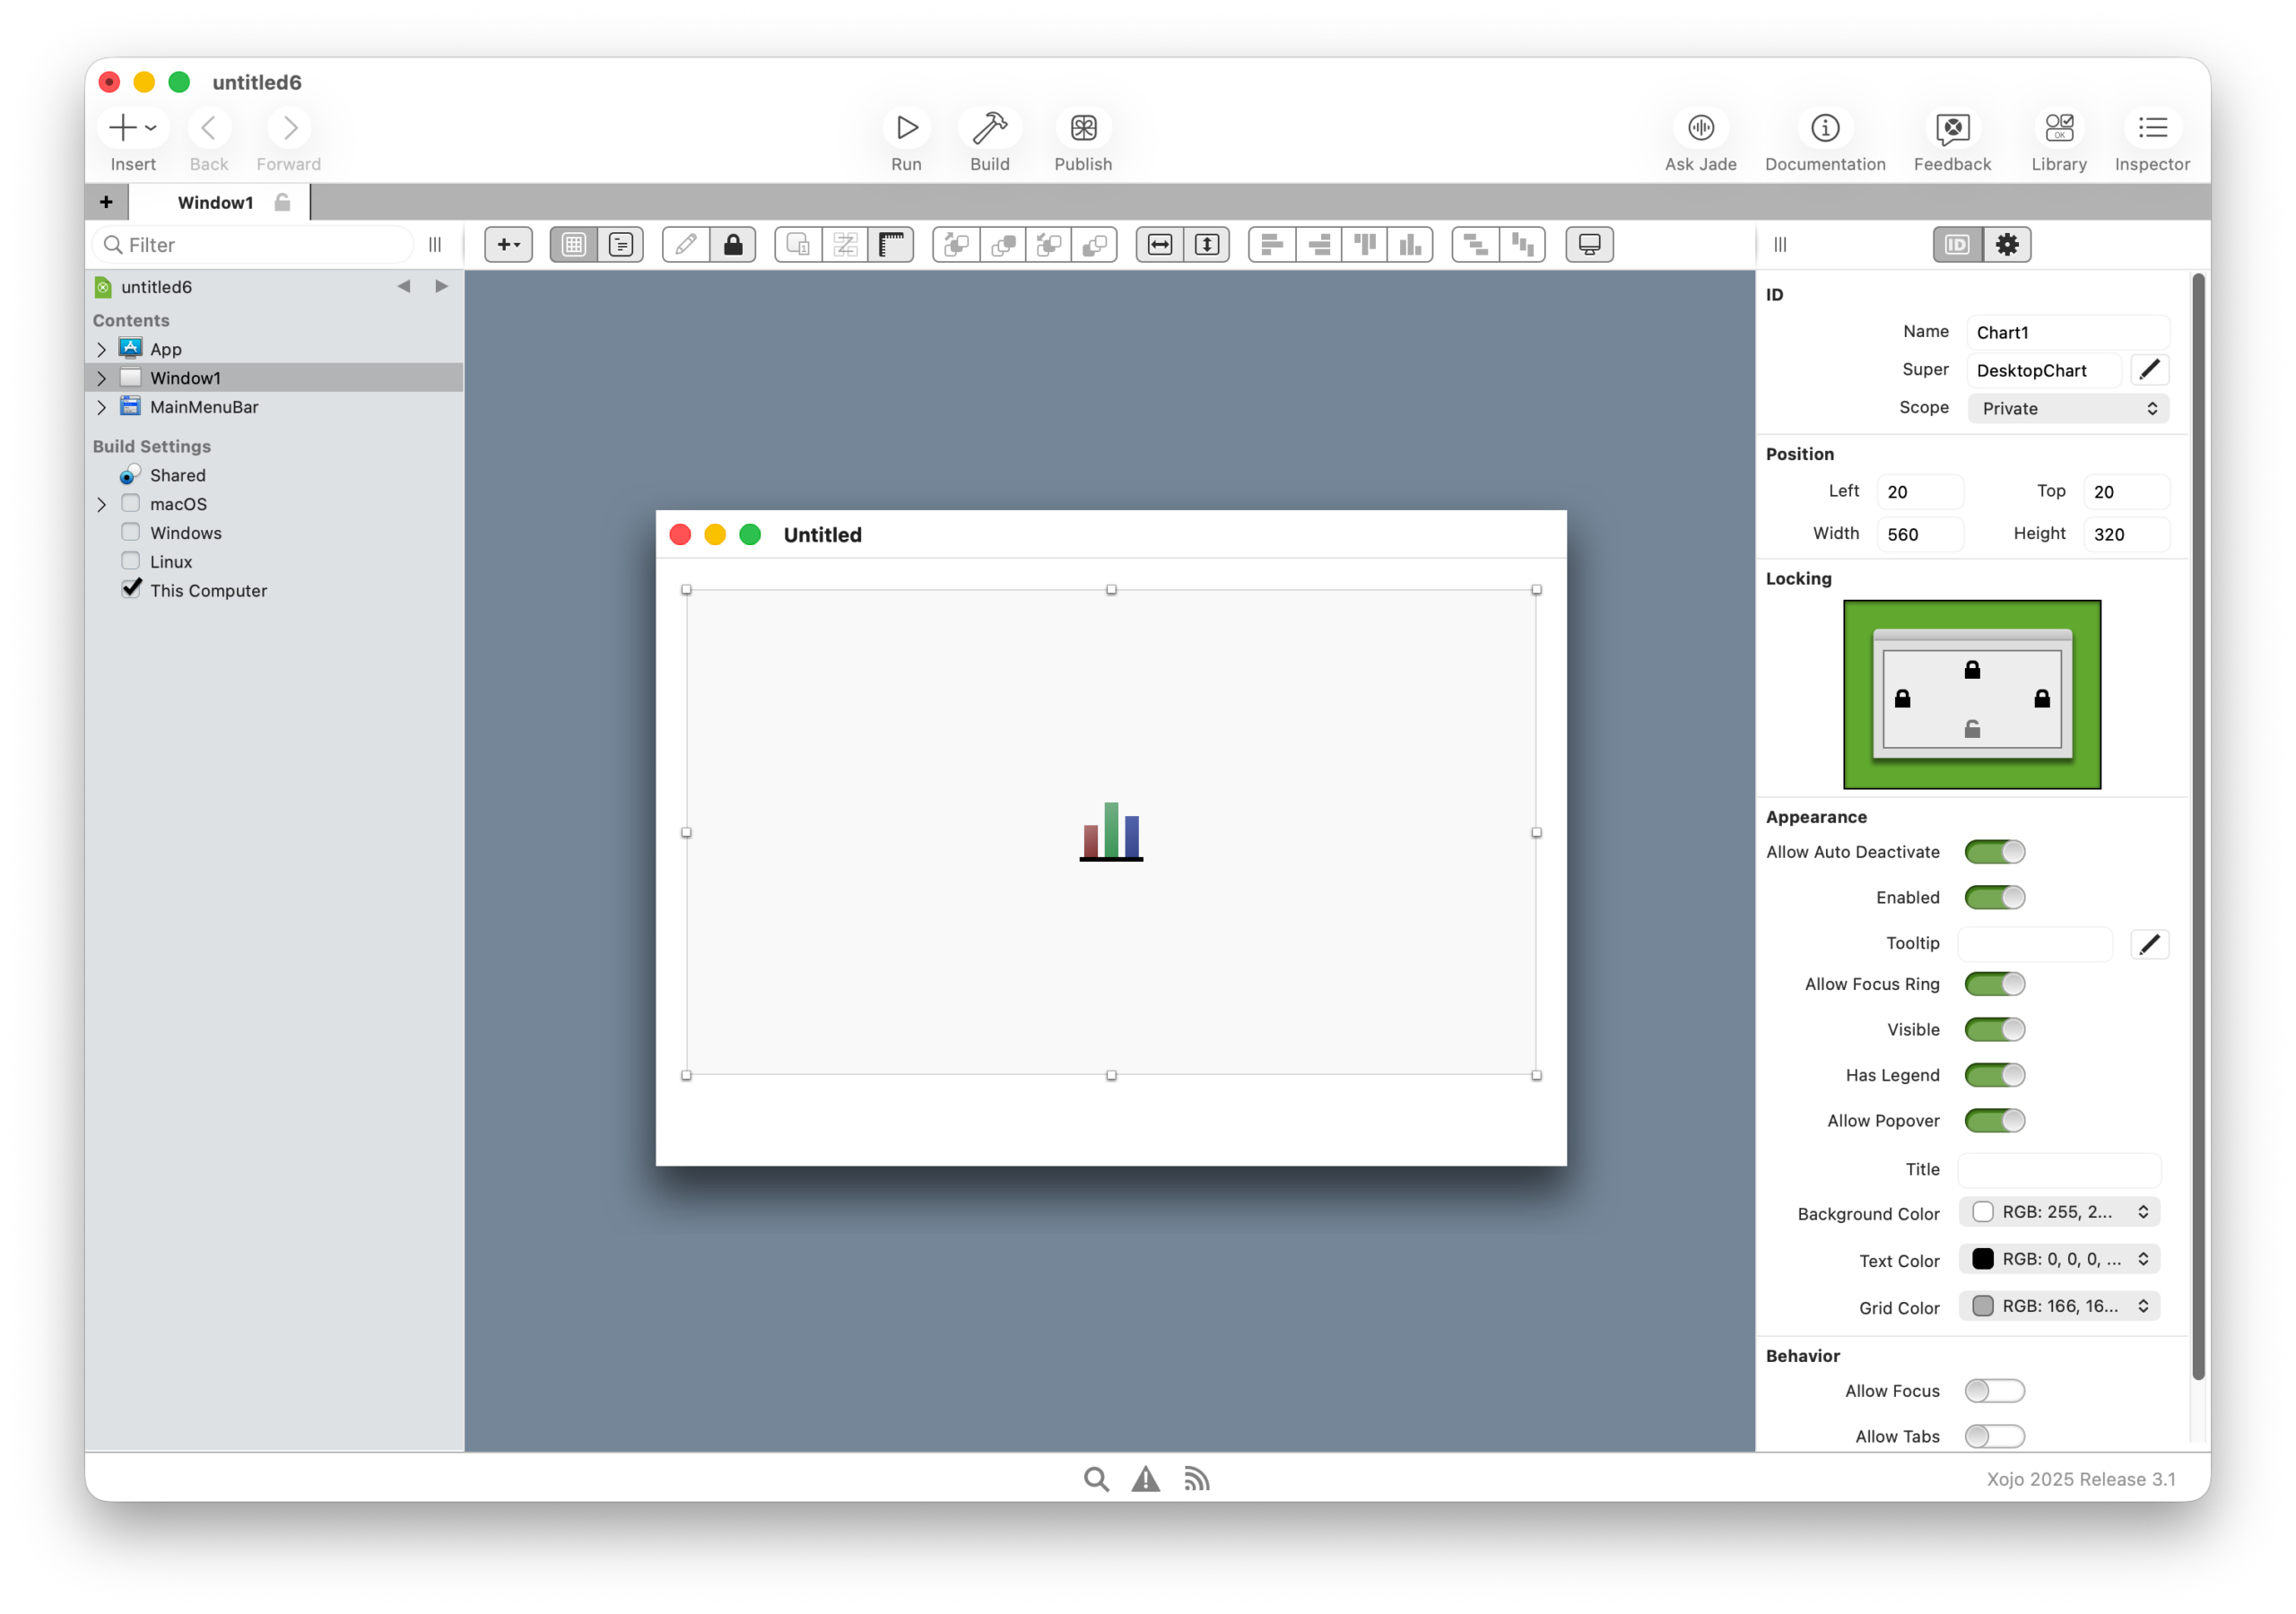
Next, select the default Window1 and drag a DesktopChart control from the Library panel into the Layout Editor for Window1. Adjust the right margin to the recommended right layout guide, then lock the Top, Left, and Right layout locks for the Chart1 instance using the Inspector. At this point, your design should look similar to this:
While you’re there, select Chart1 and, in the Inspector, set the option Behavior > Mode to Scatter.
Next, with Window1 selected, add two properties using the following values:
Property 1:
- Name: CosStyle
- Type: ChartLinearStyle
- Scope: Private
Property 2
- Name: SineStyle
- Type: ChartLinearStyle
- Scope: Private
These properties will be used to store references to the Style objects associated with the cosine and sine function DataSets.
Finally, with Window1 still selected, add the Opening event and enter the following lines of code into the associated code editor:
CosStyle = New ChartLinearStyle
CosStyle.Line = ChartLinearStyle.LineTypes.Dashed

SineStyle = New ChartLinearStyle
SineStyle.Line = ChartLinearStyle.LineTypes.Solid

DrawScatterChart
In brief, this code creates new ChartLinearStyle instances for the properties added earlier. It assigns a solid line style to connect the cosine function data points and a dashed line style to connect the sine function data points. After that, it calls the DrawScatterChart method, which is responsible for rendering the sine and cosine functions on the Chart1 instance.
Now, let’s create that method on Window1 using the following values in the Inspector:
- Name: DrawScatterChart
- Scope: Private
Type the following snippet of code in the associated Code Editor for the method:
// These are the Array variables in charge of storing the Scatter data points
// for the Sine and Cosine functions
Var sinePoints() As ChartScatterDatapoint
Var cosinePoints() As ChartScatterDatapoint
// …and these variables will handle the DataSet instances
// for the previous arrays of data points on both functions
Var sineDataSet As ChartScatterDataset
var cosDataSet As ChartScatterDataset
Const pi = 3.14159265359
Var y As Double
Var maxXValue As Double = 2.0 * pi
// Using a simple loop to feed the x and y
// values for the Sine and Cosine
For x As Double = 0.0 To maxXValue Step 0.5
y = Sin(x)
sinePoints.Add(New ChartScatterDatapoint(x, y, 1))
y = Cos(x)
cosinePoints.Add(new ChartScatterDatapoint(x, y, 1))
Next
// Next, we create the new instances for the Scatter DataSets
sineDataSet = New ChartScatterDataset(Color.Blue, sinePoints)
cosDataSet = New ChartScatterDataset(color.Red, cosinePoints)
// …and we set the Style to be used on each of them
sineDataSet.Style = SineStyle
cosDataSet.Style = CosStyle
// … and of course the labels to be shown on the Legend section
// of the chart itself
sineDataSet.Label = "Sine Function"
cosDataSet.Label = "Cos Function"
// As the last step, we add both DataSets to the chart
// so these can be rendered
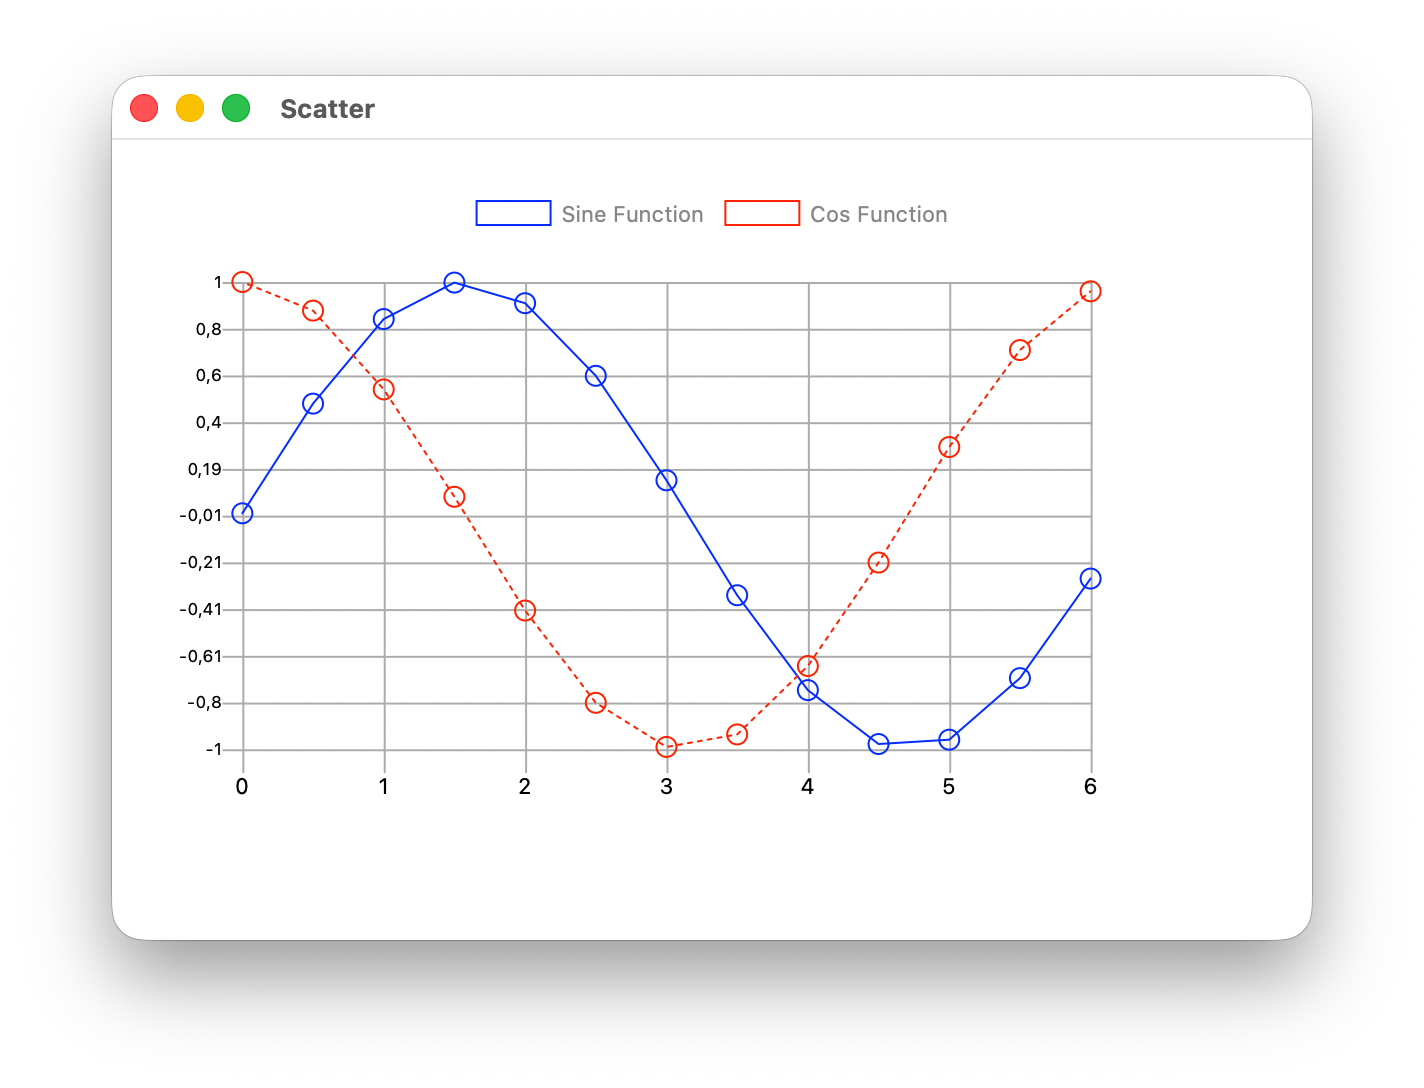
Chart1.AddDatasets(sineDataSet, cosDataSet)Run the app, and it should look similar to this:
A change of Style… on the fly!
As with many aspects of DesktopChart, any changes made at runtime are reflected immediately, without the need to redraw the chart, re-feed the data sets, or perform any other complex operations. Let’s take advantage of this by changing the sine and cosine styles at runtime, allowing users of our example app to toggle whether the points are connected.
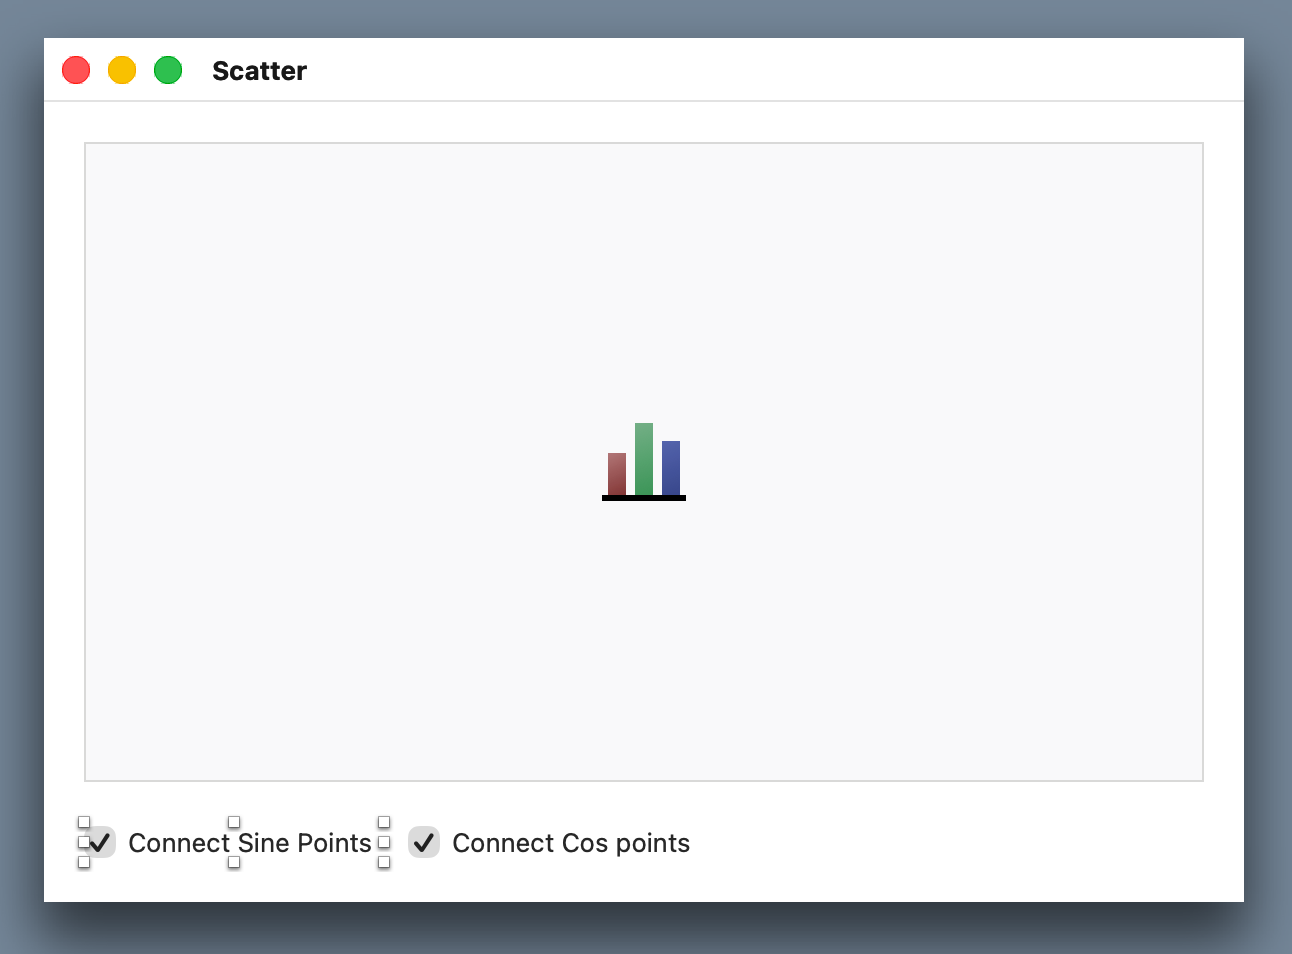
Add two DesktopCheckBox controls below the bottom margin of the Chart1 instance on Window1. Set the Caption of the first checkbox to “Connect Sine Points” and the second to “Connect Cos Points.” For both checkboxes, use the Inspector to set Initial State > Visual State to Checked.
The final layout should look similar to this:
Lastly, add the ValueChanged event to both CheckBox instances. Then, for the checkbox with the caption “Connect Sine Points,” add the following lines of code to its event handler:
If Me.Value Then
  SineStyle.Line = ChartLinearStyle.LineTypes.Dashed
Else
  SineStyle.Line = ChartLinearStyle.LineTypes.None
End If
Add the following lines of code to the ValueChanged event handler for the checkbox with the caption “Connect Cos Points”:
If Me.Value Then
  CosStyle.Line = ChartLinearStyle.LineTypes.Solid
Else
  CosStyle.Line = ChartLinearStyle.LineTypes.None
End If
Run the app again and, this time, click each checkbox to see how the points are no longer connected when a checkbox is unchecked, and are connected when it is selected.
Summary
As you can see, styles can be used not only to connect points in a Scatter chart, but also to customize the point endpoints beyond the default appearance. For example, you can set the endpoint to “None” or choose from many other available options. Even better, any changes made to a style at runtime are applied immediately.
Javier Menendez is an engineer at Xojo and has been using Xojo since 1998. He lives in Castellón, Spain and hosts regular Xojo hangouts en español. Ask Javier questions on Twitter at @XojoES or on the Xojo Forum.