
In the world of software development, efficiency is a central aspect. This is especially true for applications developed in Xojo. Excessive overhead can significantly impair performance and negatively affect the user experience. In this article, we will take a detailed look at what overhead is, how to identify it, and what techniques, tips, and tricks can be used to minimize it. We will particularly focus on using code profiling.
What is Overhead?
Overhead refers to the additional computational and memory effort that does not directly contribute to the execution of the main tasks of an application. This can arise from various factors, such as inefficient algorithms, unnecessary computations, or redundant memory allocations. High overhead can lead to slow response times and increased resource consumption.
Identifying Overhead with Code Profiling
To effectively minimize overhead, it is first important to identify it. This is where code profiling comes into play. Profiling is a runtime analysis technique that provides insight into how long certain parts of your code take to execute and how often they are called. Xojo offers integrated tools for this purpose, such as the Profiler, which gives you detailed information about your application’s performance. Code profiling is available on all targets except Android.
Steps to Profiling in Xojo:
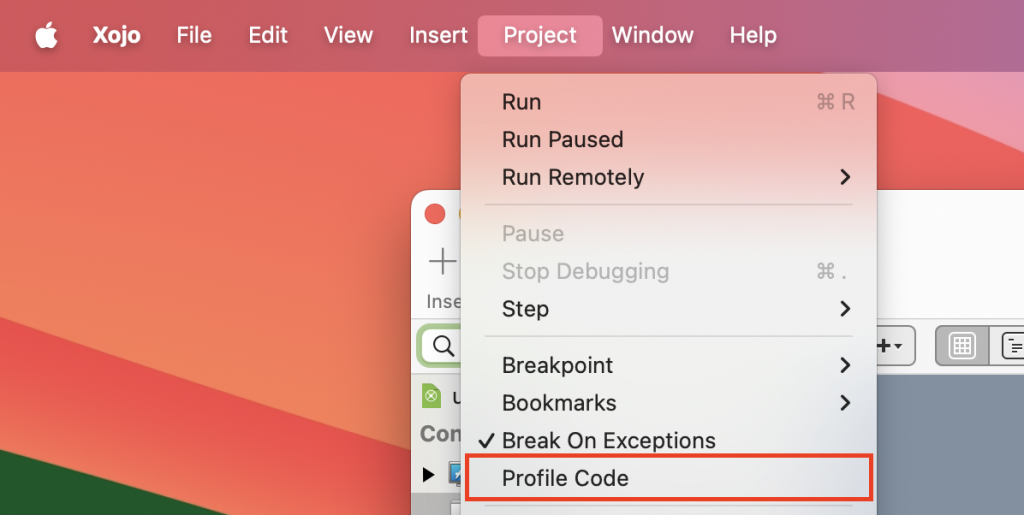
- Activating the Profiler: Go to the menu item Project > Profile Code to enable or disable the profiler.
- Manual Profiling with StartProfiling and StopProfiling: Use the StartProfiling and StopProfiling methods in your code to analyze specific sections.
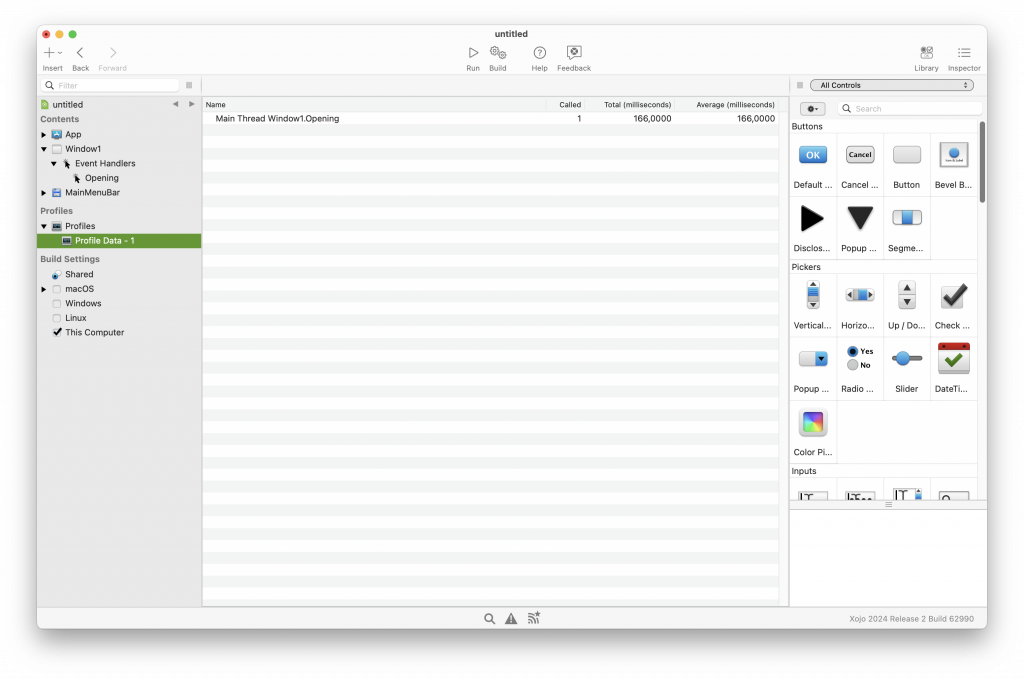
- Analyzing the Profiler Results: After running, you will receive a report showing which methods and functions take the most time.
For more information on the Code Profiler, see the Xojo Documentation.
Example of Manual Profiling
With StartProfiling and StopProfiling, you can target specific parts of your code for profiling. Here’s a simple example:
Var total As Integer = 0

// Start profiling
System.DebugLog("Profiling started")
StartProfiling

For i As Integer = 0 To 1000000
  total = total + i
Next

// Stop profiling
StopProfiling
System.DebugLog("Profiling stopped")
In this example, the profiler is activated only for the loop to analyze its performance precisely.
Techniques to Minimize Overhead
Once you have identified the areas with optimization potential, you can apply various techniques to reduce overhead:
1. Algorithmic Optimizations:
– Use more efficient algorithms. An O(n) solution is better than an O(n^2) solution.
– Avoid recursive algorithms when iterative solutions are available to avoid stack overhead.
2. Memory Management:
– Minimize unnecessary memory allocations and deallocations.
– Use local variables as much as possible and avoid global variables to reduce memory consumption.
3. Data Structures:
– Choose the right data structures for your requirements. For example, arrays are often faster than other structures for sequential data access.
– Use dictionaries for fast lookups as they manage key-value pairs efficiently.
4. Asynchrony and Parallelism:
– Use asynchronous programming and multithreading to perform tasks in parallel and improve the responsiveness of the user interface.
5. Code Simplicity:
– Write clear and simple code. Complex structures and nested loops increase overhead.
– Use Xojo’s pre-built functions and libraries, which are often more optimized than custom implementations.
Tips and Tricks for Optimization
1. Lazy Loading:
Load resources only when they are needed instead of loading everything at the start of the application.
2. Caching:
Implement caching mechanisms to avoid repeated computations and database queries.
3. Avoiding Polymorphism:
Polymorphic calls are often more expensive than direct function calls. Use them only when necessary. Polymorphism is a concept in object-oriented programming that allows objects of different classes to be treated through a common interface. In Xojo, this means you can define methods in a base class and override them in derived classes. However, this can add overhead as the exact method call must be resolved at runtime.
4. Using Breakpoints and Inspectors:
Set breakpoints and use the debugger inspector to check runtime data and identify inefficient parts of the code.
Example: Optimizing a Loop
Here is an example of how to optimize a loop:
// Unoptimized code
Var total As Integer = 0
For i As Integer = 0 To dataArray.LastIndex
  total = total + dataArray(i)
Next

// Optimized code
Var total As Integer = 0
Var lastIndex As Integer = dataArray.LastIndex
For i As Integer = 0 To lastIndex
  total = total + dataArray(i)
Next
In this example, we moved the LastIndex method call out of the loop since repeatedly calling it creates unnecessary overhead.
Minimizing overhead in Xojo applications requires careful analysis and optimization of your code. By using code profiling, you can identify the areas that consume the most runtime and take targeted actions to optimize them. The techniques, tips, and tricks presented here can significantly improve the efficiency of your applications and ensure a better user experience.
Leverage Xojo’s powerful tools to keep your applications lean and fast, and benefit from improved performance.
Happy coding!
Martin T. is a Xojo MVP and has been very involved in testing Android support.