July’s Year of Code theme is charting. Charting uses the DesktopChart, WebChart or MobileChart controls to make your data stand out with visualizations like Bar, Bubble, Pie, Scatter charts and more.
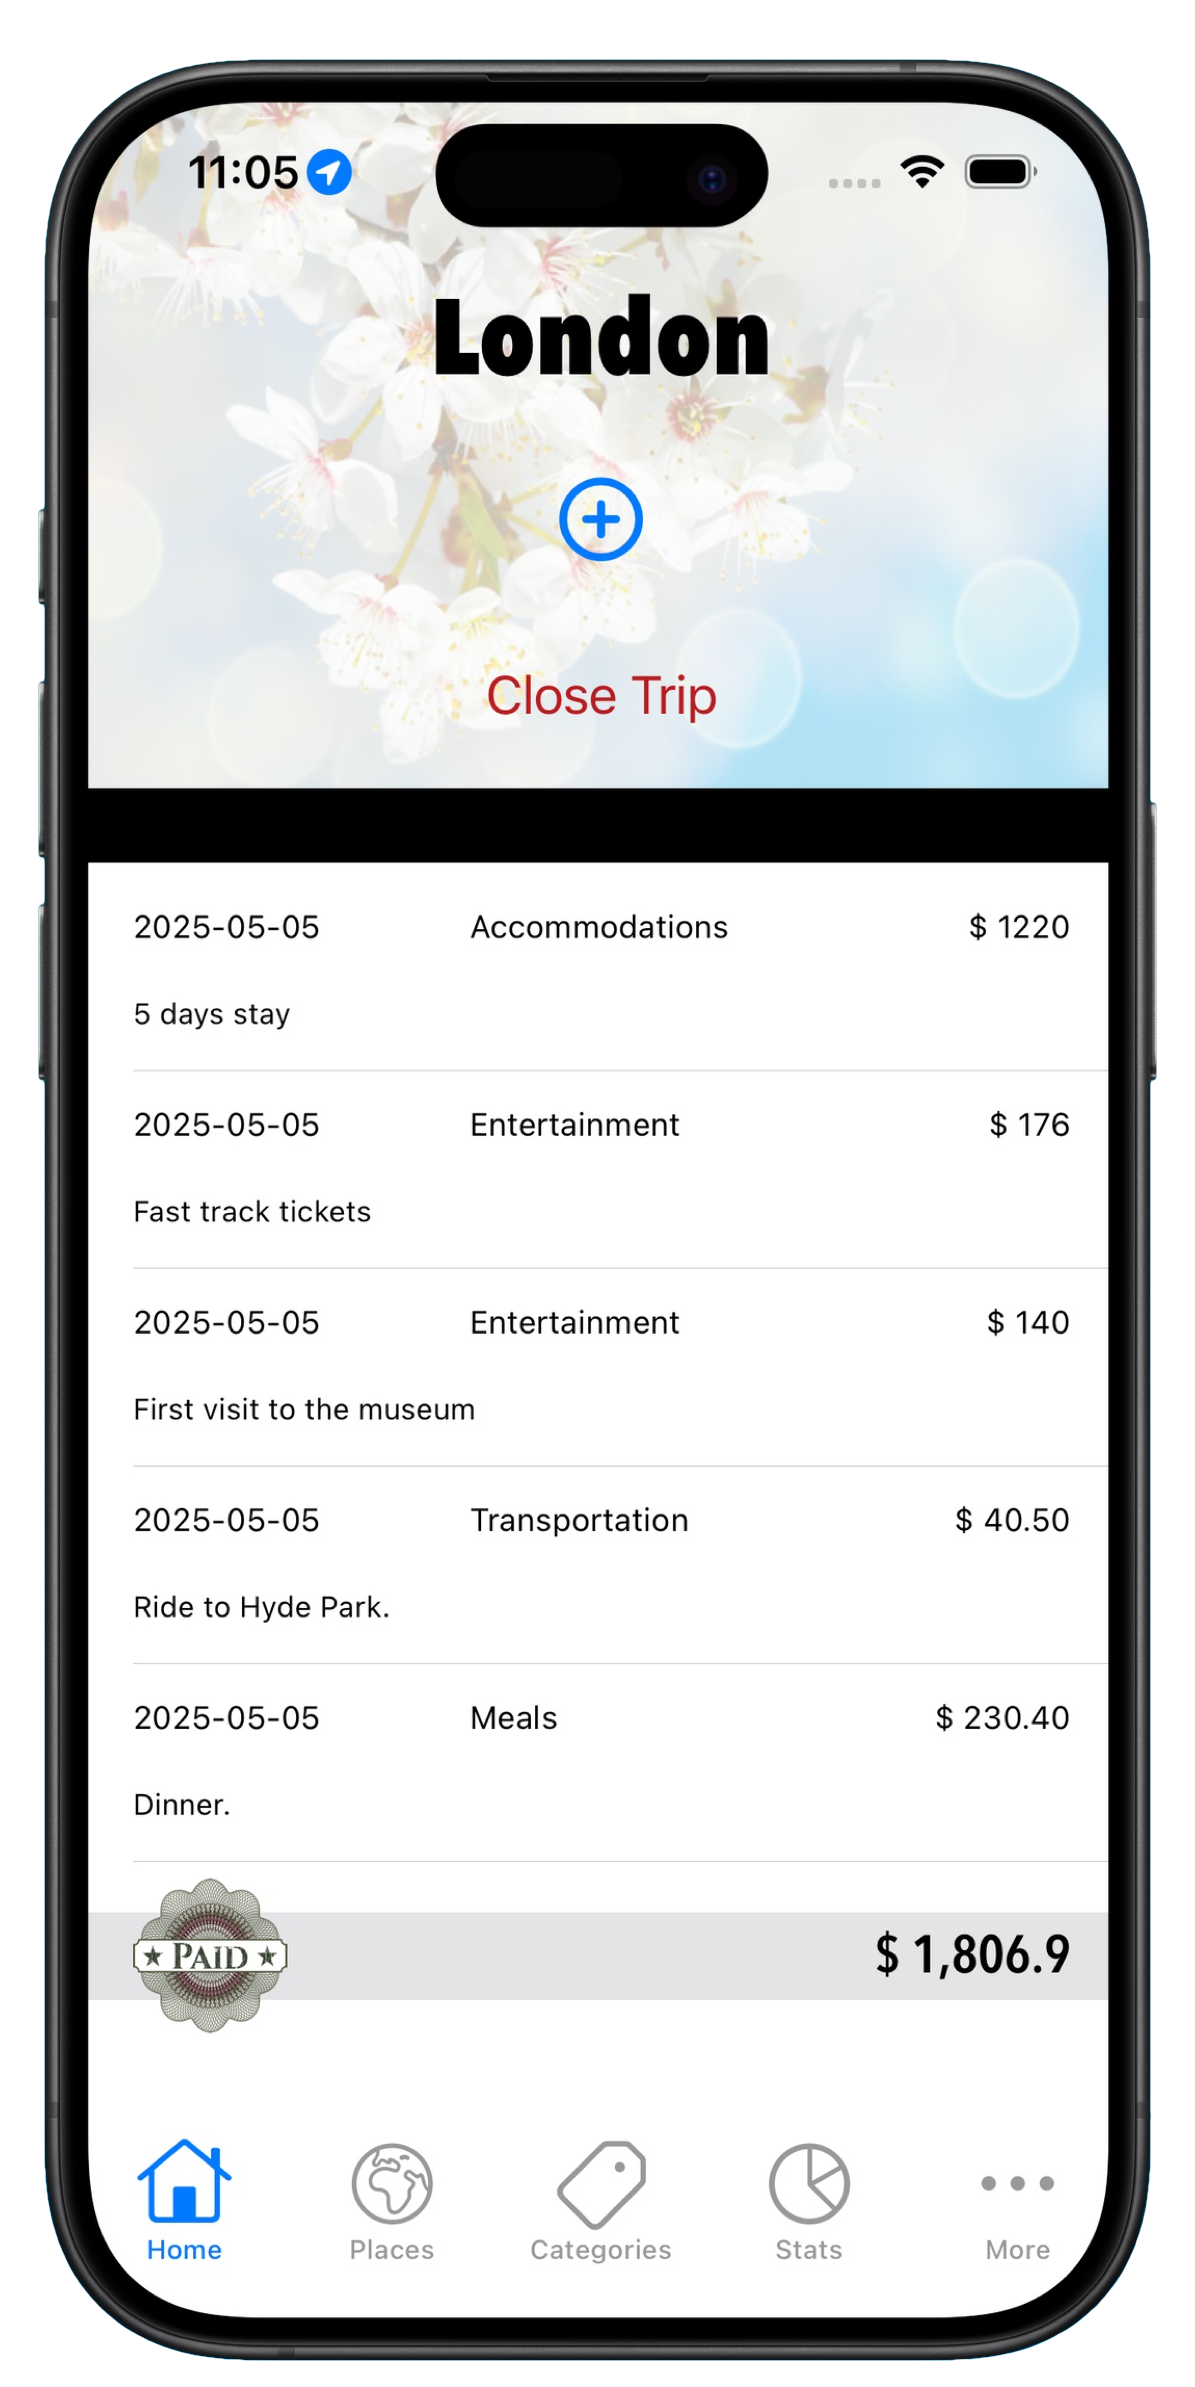
For this project, I created a small iPhone app to track my expenses – something I personally needed. While it’s designed for tracking holiday and travel spending, it works just as well for managing general monthly expenses.
Far from perfect, but useful for the described scenarios, this iPhone app lets the user set a trip location, add a description and even define a budget. That way, they can check in at any time to see how things are going during a trip or when tracking general monthly expenses. (It doesn’t make much sense to offer this kind of app for iPad.)

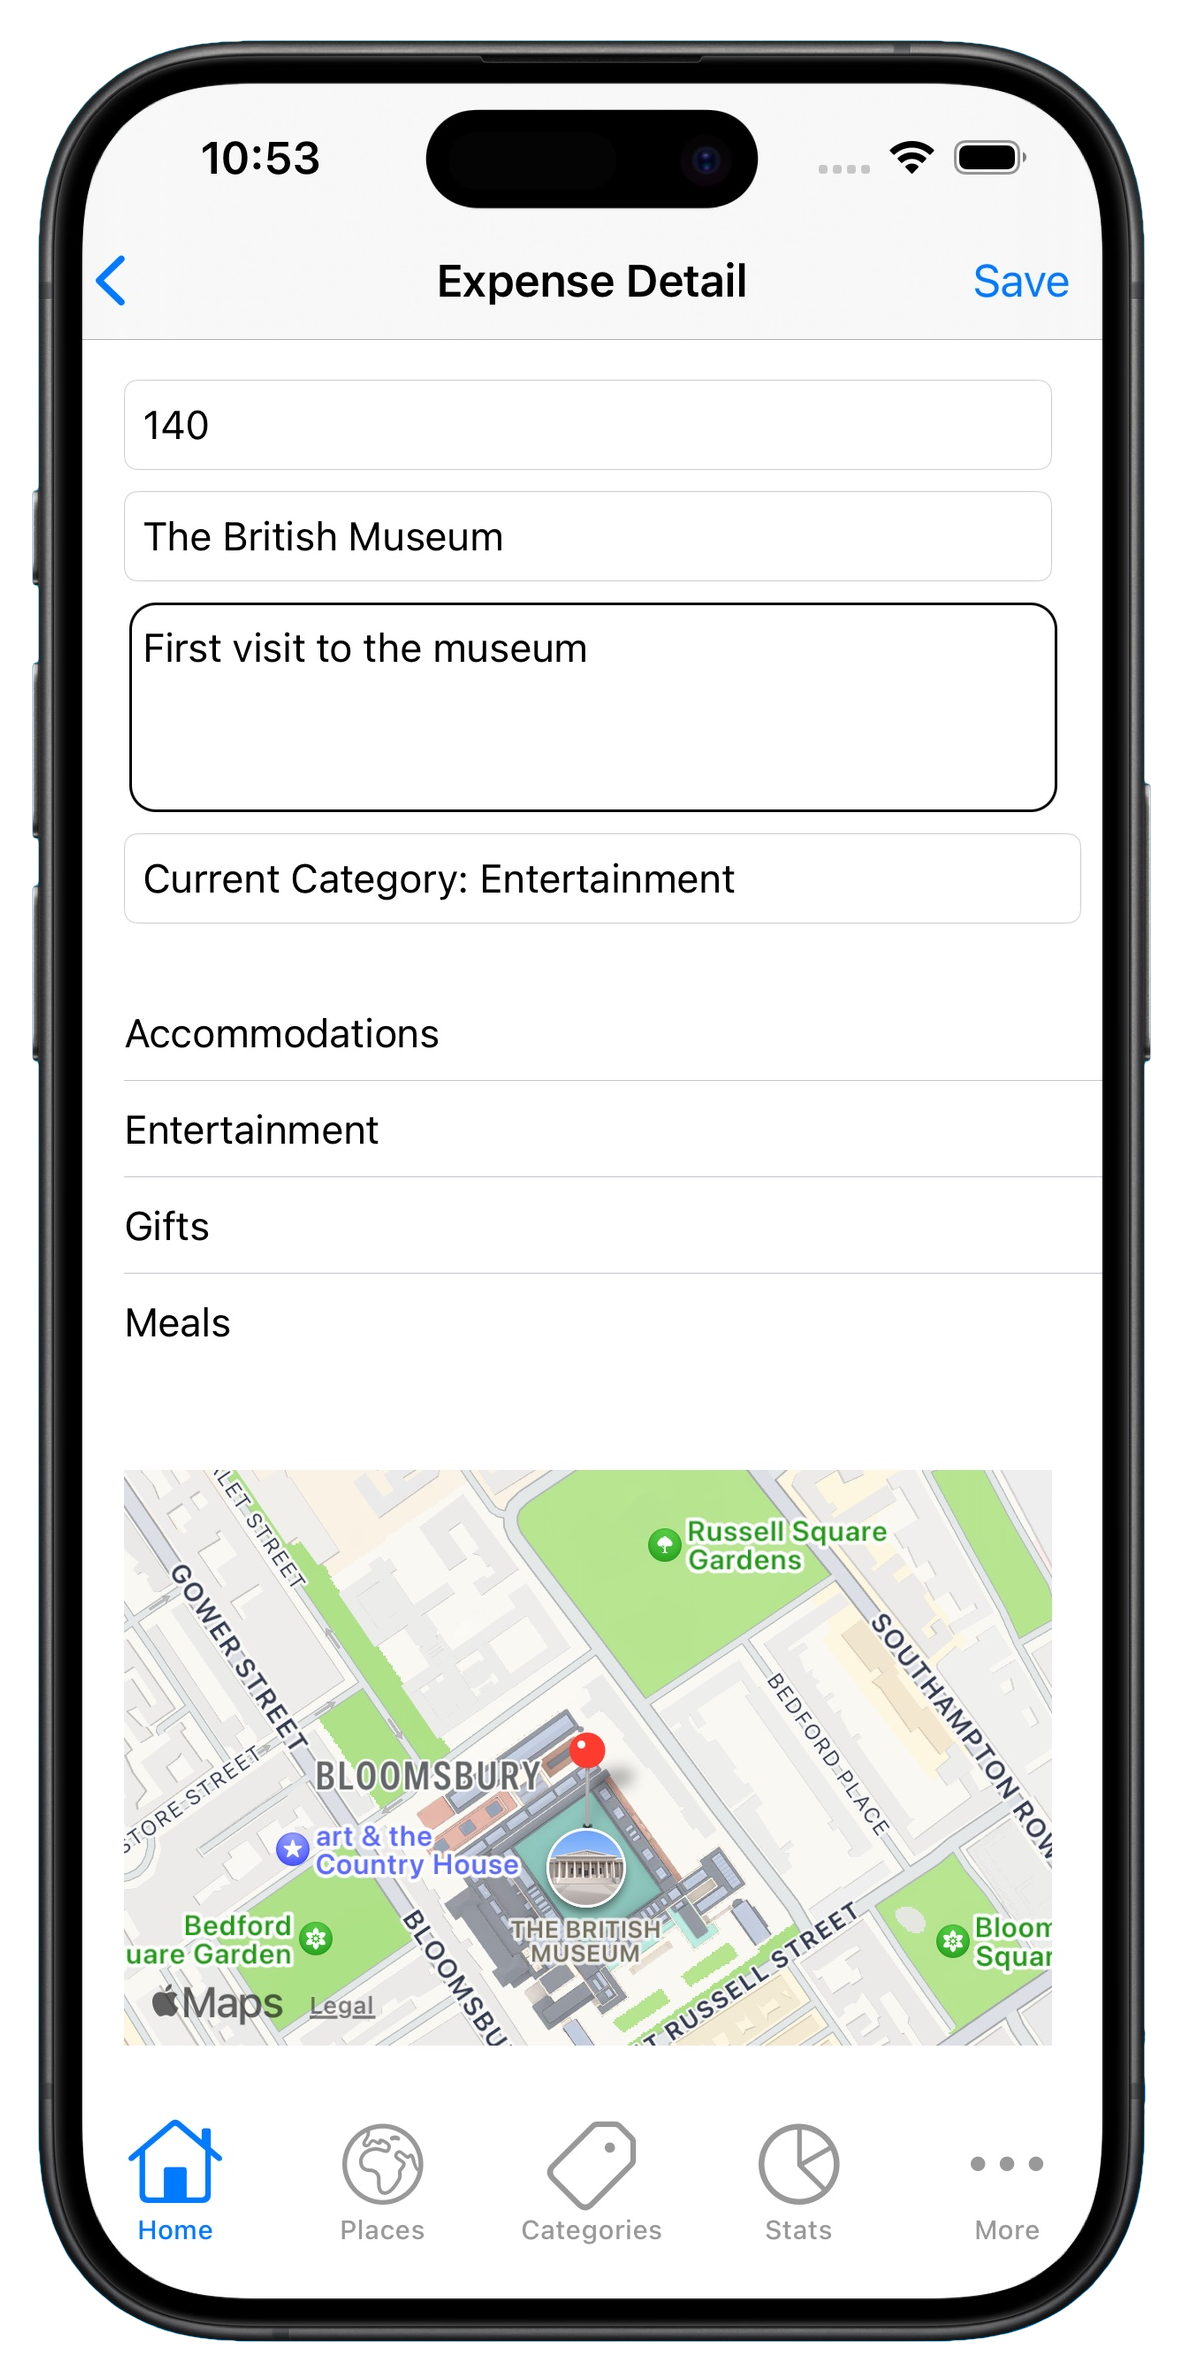
When it comes to entering new expenses, I wanted to keep it as simple as possible with minimal input and just a few taps. So, aside from entering the amount and the place where the expense occurred, the app automatically captures the geolocation. This helps me better remember places like restaurants, gas stations or points of interest I might want to stop at or visit again when traveling the same route.

When tracking monthly expenses, the app lets you duplicate existing entries so details like the expense location remain the same, and you only need to enter the new amount. This is especially handy if you tend to refuel at the same gas station or do your weekly grocery shopping at the same store.
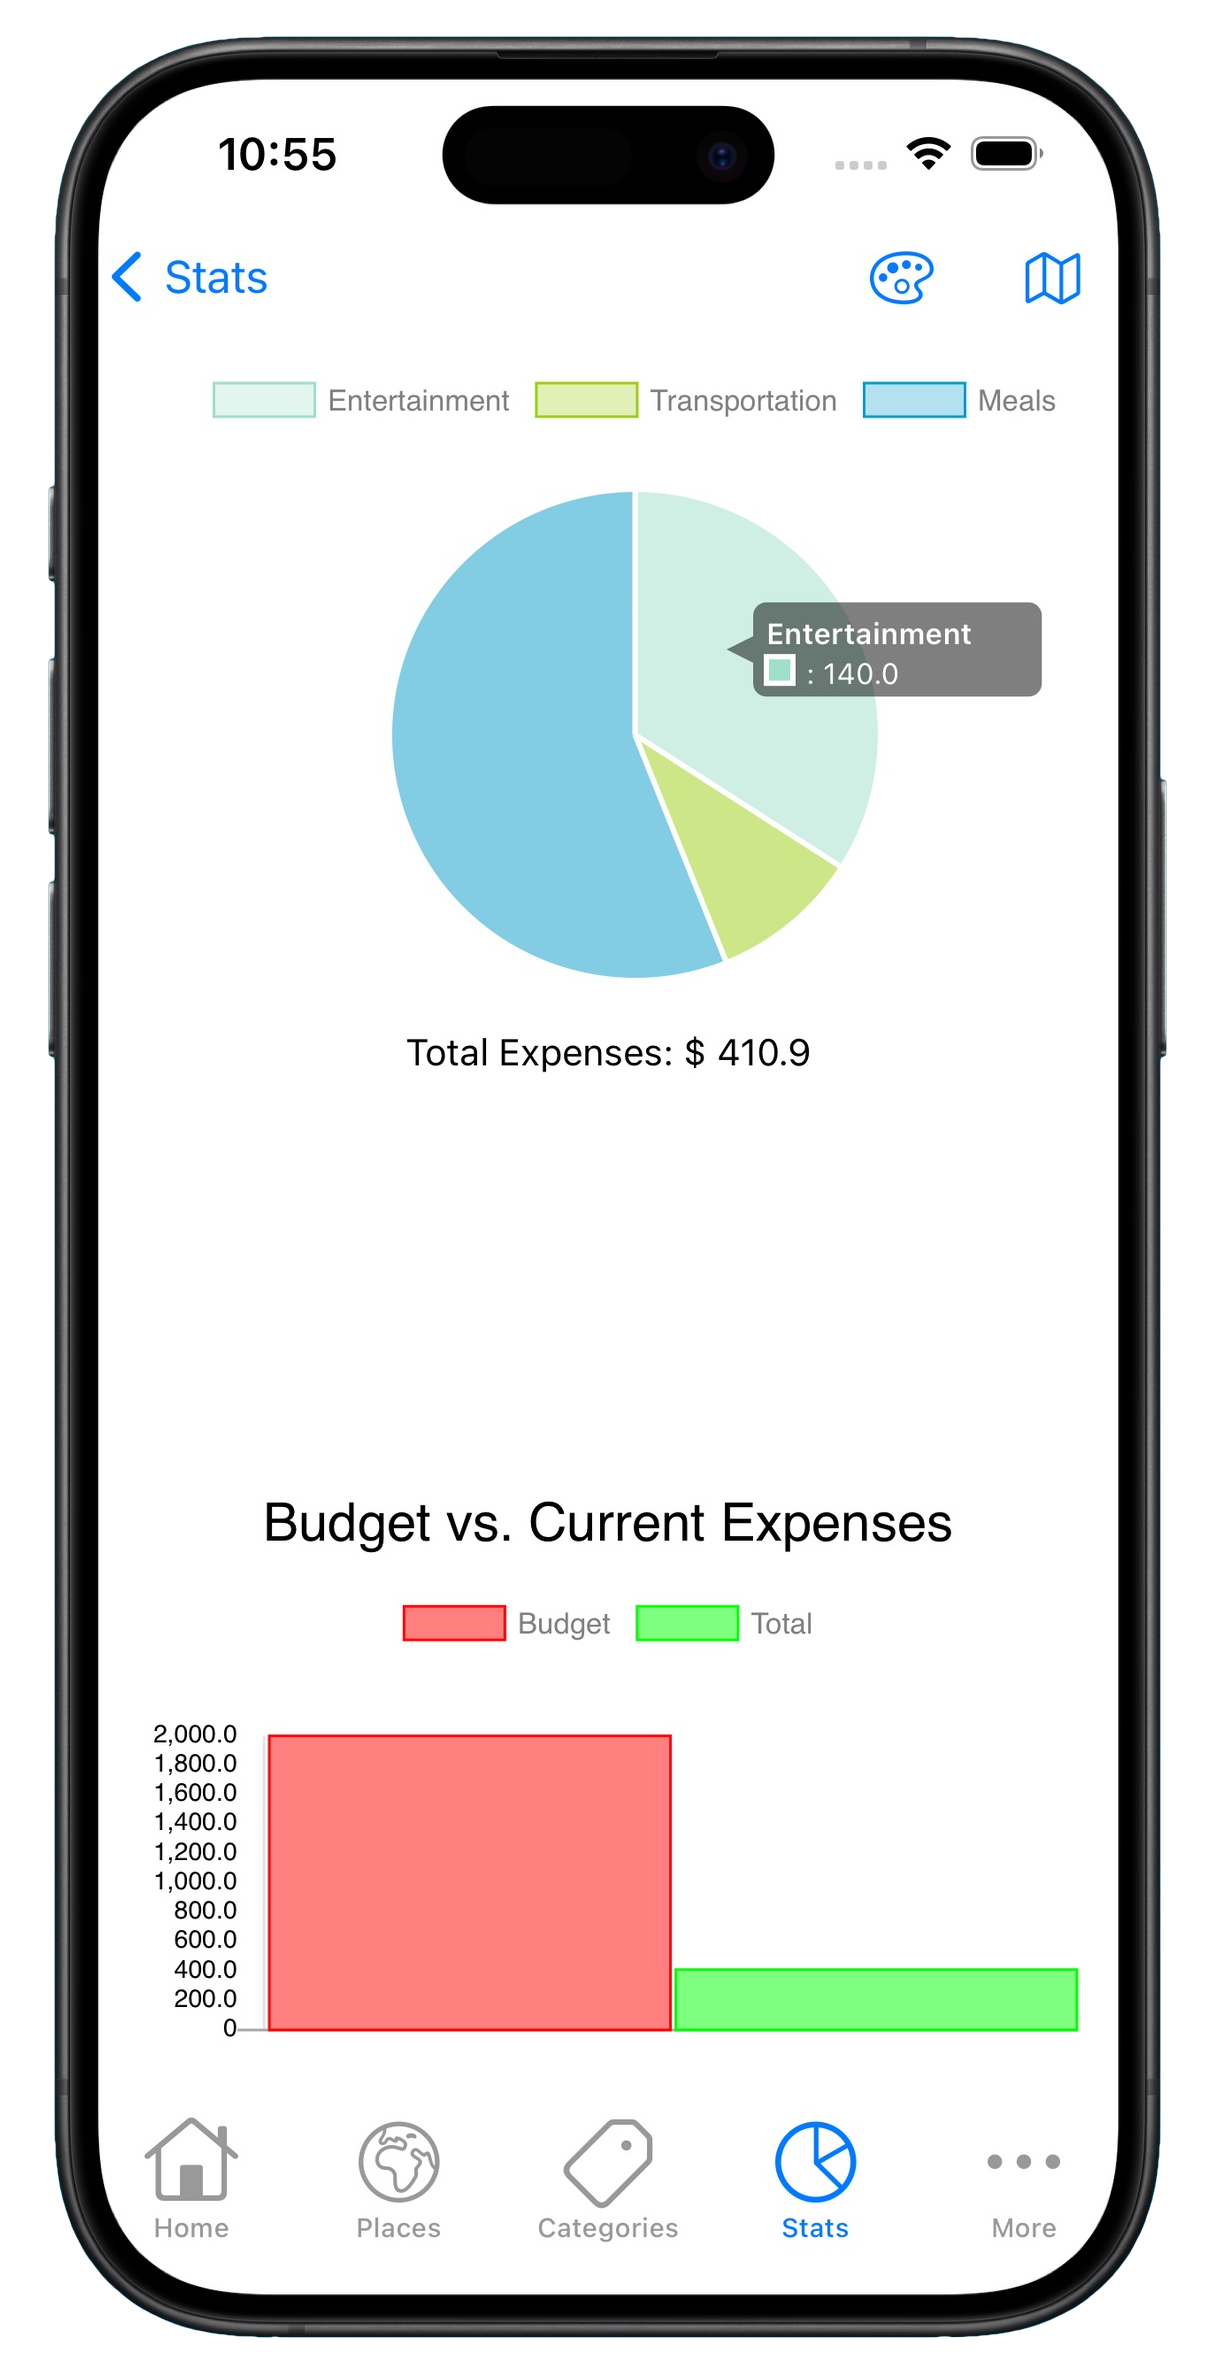
So, what about charts? Honestly, this area has plenty of room for improvement and could eventually include a wide range of stats and visualizations. But for this initial release, I kept it simple to meet my own needs. In addition to the basic ‘Total Budget vs. Current Expenses’ stats, the app includes a Pie chart that breaks down spending by category.

Of course, you can download the full source code here and adapt or improve it so it suits your own needs.
Want to give it a try? The iOS app is available for free on the App Store: https://apple.co/3EGL33r
VoyageExpenses is built entirely with Xojo. It’s 100% Xojo code, with only two small exceptions where Declares were needed. It was published to the App Store using the Publish feature introduced in Xojo 2025r1.
Visit the Xojo Docs to learn more about using charts in Xojo. Visual elements like charts can make the data in your apps more memorable and impactful. We’ve written extensively on charting throughout the Xojo Blog.
Year of Code Project
- Year of Code: Kickoff
- January Project: Desktop Apps | Forum Discussion
- February Project: Database Apps | Forum Discussion
- March Project: Web Apps | Forum Discussion
- April Project: User Interface | Forum Discussion
- May Project: Mobile Apps | Forum Discussion
- June Project: Code Sharing | Forum Discussion
- July Project: Charting | Forum Discussion
- August Project: Console Apps | Forum Discussion
- September Project: Games | Forum Discussion
- October Project: Multi-Platform | Forum Discussion
- November Project: PDF | Forum Discussion
How to Play:
Each month we’ll announce a new theme and share an example project of our own. Share your projects to the Xojo Forum thread for that month via GitHub (all the links you need are posted above ↑ ). Learn how to use Xojo and GitHub.
The Prizes:
Monthly winners get $100 at the Xojo store. Every month you submit a project is another chance to win the grand prize. The grand prize is $250 cash plus a Xojo Pro license and a year of GraffitiSuite and will be announce in December. Learn more about the prizes.
Javier Menendez is an engineer at Xojo and has been using Xojo since 1998. He lives in Castellón, Spain and hosts regular Xojo hangouts en español. Ask Javier questions on Twitter at @XojoES or on the Xojo Forum.
