
In Xojo there is a new class, GraphicsPath, that you can use to create graphics as a mathematical description of shapes and lines; ranging from simple lines to Bézier curves, arcs, rectangles, there are many advantages to using these! For example, as a class on its own, it doesn’t even needs a graphical context (Graphics) in order to describe the shapes you want to use, and the mathematical representation means more control and precision. Simply put, you only need to join the points!
The available methods in the class give you the ability to create any shape you need in an easier way when compared with the Object2D class (and other classes you may use in combination), from simple rectangles (including the “rounded” variation), to arcs, curves or quadratic curves (Bézier curves) where we model them through a control point.
The interesting thing in GraphicsPath is that every call to any of these methods have the starting coordinate the ending point of the previous shape in the path, while you can use the MoveToPoint method in order to, well, move the virtual “cursor” to any point of your election without painting anything in the process. Thus, this one would act as the starting (or initial) point for the next method drawing in the path.
As for the available properties, you can use these:
- CurrentPoint. Check this value in order to know the current coordinate, so you can make the proper decision about what to do next in your code.
- IsEmpty. This one allows us to know if the path is empty; this is, it doesn’t contain any shape definition in it.
- IsRectangle. This property is really useful to know if we are dealing with a rectangle shape in our GraphicsPath instance.
Starting your Path…
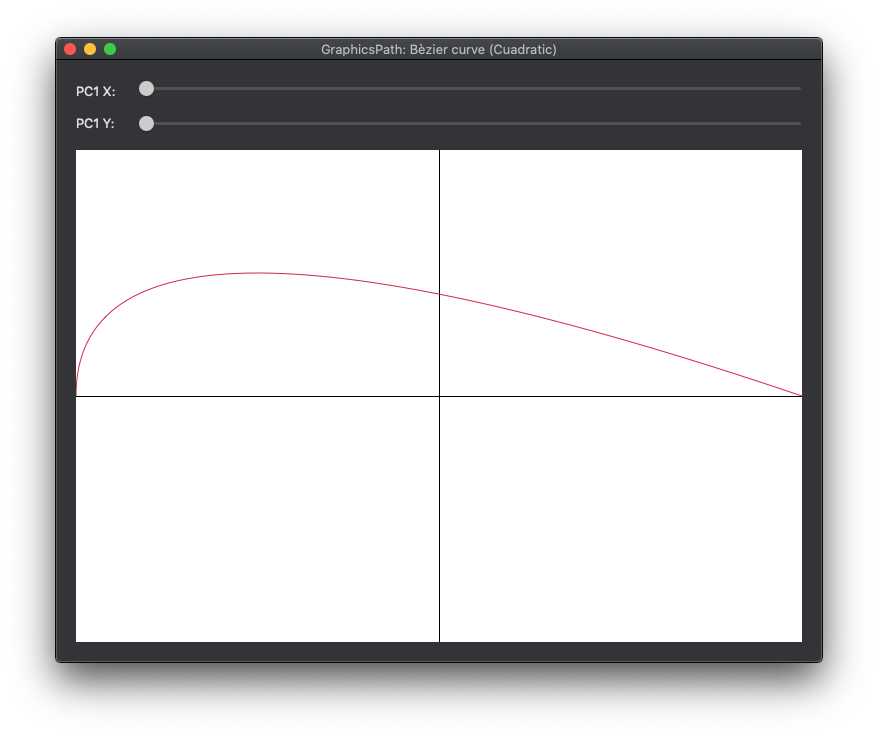
Let’s see how simply it is to apply these principles during the creation of a graphic making use of a Bézier curve, and the best part is that this example project lets us move that control point, so you can make a better idea about how it goes. This is the final look of our example application:
1. Designing the User Interface
The user interface for our example app is quite simple, with a few controls in it:
- 2 Labels
- 2 Sliders. Use the Inspector Panel on them to activate the “Allow Live Scrolling”, under the Behavior section.
- 1 Canvas control.
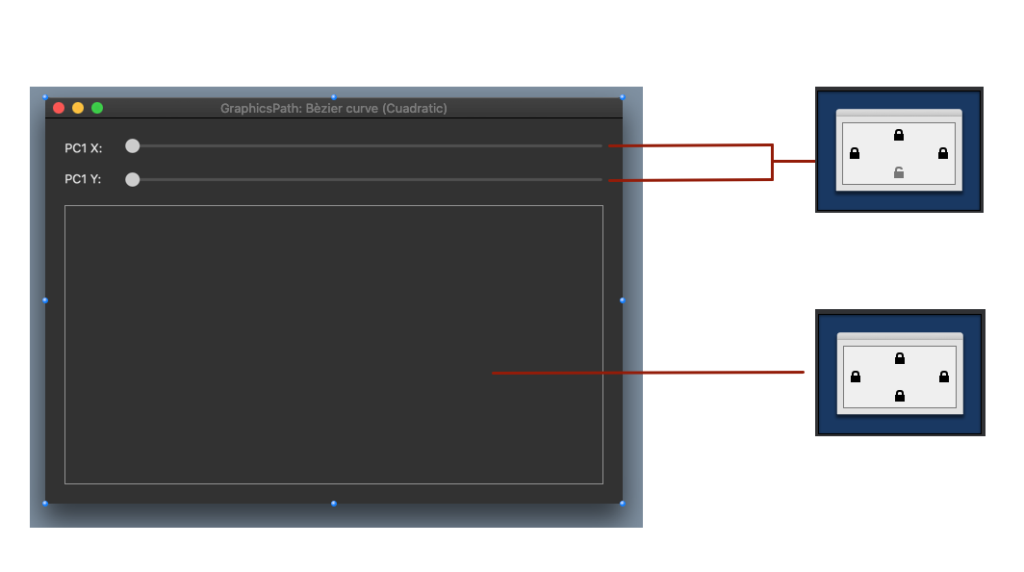
Set the Locking properties in the Inspector Panel for the Sliders and the Canvas, as shown in the picture. This will allow the controls to properly resize when the Window size is changed by the user.
2. Creating your own Graphic Canvas (Canvas subclass)
We need the Canvas to be specialized, so that means that we need to subclass the Canvas class and put in all the specific stuff we may need.
Add a new Class to the project (Insert > Class), and access the Inspector Panel to change the values of the following properties:
- Name: CuadraticCanvas
- Super: Canvas
Next, add two Computed Properties. For that, make sure you selected the just added class in the Navigator, and access the contextual menu to choose the Add to “CuadraticCanvas” > Computed Property option.
Change the following fields in the associated Inspector Panel:
- Name: PC1X
- Type: Double
Next, choose the “Set” method on the Computed Property and add this single line of code after the existing one:
invalidate
This will force our canvas to redraw itself every time we change the value of the X point in the coordinate of our Bézier curve.
Repeat the operation in order to add a second Computer Property, using the following values this time:
- Name: PC1Y
- Type: Double.
Remember to add the “Invalidate” line of code to the “Set” method on this property too.
Now is time to add the Paint Event Handler to our class. For that, and with our class item still selected on the Navigator, access the contextual menu and choose the Add to “CuadraticCanvas” > Event Handler option.
In the resulting panel, select the Paint entry from the left list and confirm the selection. The last action will add the new event to the class, bringing the associated Code Editor. Write the following code snippet:
g.AntiAlias = True

g.DrawingColor = &cffffff
g.FillRectangle(0,0,g.Width,g.Height)
g.DrawingColor = &c000000
g.DrawLine(g.Width/2,0,g.Width/2,g.Height)
g.DrawLine(0,g.Height/2,g.Width,g.Height/2)

g.DrawingColor = &ccc1233

Var gp As New GraphicsPath
gp.MoveToPoint(0,g.Height/2)
gp.AddQuadraticCurveToPoint(Me.pc1x,Me.pc1y,g.Width,g.Height/2)

g.DrawPath gp
As you can see, here is where we create our GraphicsPath instance (the “gp” variable) so we can use it to add the quadratic curve using as the control point the values of our “PC1X” and “PC1Y” properties.
In order for our GraphicsPath instance to be drawn in the graphical context (the “g” parameter), we need to use the DrawPath method passing along our “gp” object as argument.
3. Joining the Points
Choose the “Canvas1” item in the project Navigator and access the Inspector Panel so you can change the “Super” value to “CuadraticCanvas”.
Next, select the “Slider1” item and add the “ValueChanged” Event Handler to it. Write this line of code in the associated Code Editor:
canvas1.pc1x = me.Value
Repeat the operation with the “Slider2” item, except that this time you need to change the line of code slightly:
canvas1.pc1y = me.Value
We are almost done! Select now the “Window1” item in the project Navigator and add these two events to it: Open and Resizing. Write this line of code in both event handlers:
SetSliders
Finally, we will add a new method to the Window1 item. For that, select the Window1 item in the project Navigator (if it is not yet selected), and access the contextual menu in order to choose the Add to “Window1” > Method option. Make use of the Inspector Panel to reflect this method signature:
- Method Name: SetSliders
And write the following code snippet in the associated Code Editor for the method:
slider1.MaximumValue = canvas1.Width
slider2.MaximumValue = canvas1.Height
canvas1.PC1x = Slider1.Value
canvas1.PC1y = Slider2.Value
This will be the method in charge of updating the maximum value of the sliders to the width and height of the window, and also to update our canvas control properties forcing it to redraw itself with the new values.
In Good Shape!
We have everything set now. Run the app and use the sliders to move the Bézier curve control point. As you change the sliders values, you’ll see how the curve smoothly updates its shape in the canvas.
You have a starting point now! Try to use the other methods available in the GraphicsPath class in order to make more complex drawings in your own apps!