
Starting in Xojo 2022r2 you have the option to generate Program Database (PDB) files with your 64-bit Windows builds. If you’re unfamiliar with what PDB files are, or how they are used, then this post will help explain how PDBs can assist you with your debugging needs.
While our debugger is a powerful tool in helping you track down bugs in your program, there are times when tricky problems arise that go beyond the scope of what our debugger can handle. It’s times like these that PDBs can potentially come to the rescue.
So what is a PDB file? In short, PDBs are a file format developed by Microsoft for storing debugging information about a program. The most important part is how it maps each function address to its equivalent function name. Let’s take a simple example to see how this looks when we don’t have a PDB to help us.
The Offending Code
Var mb As New MemoryBlock(8)
mb.Int64Value(0) = 1
mb = mb.Ptr(0)

// At this point the MemoryBlock is pointing to memory location
// 0x1 which should not be accessible.
mb.StringValue(0, 4) = "Test"
In this example, we’re purposely causing a hard crash here by accessing memory that is not ours to access. Add the offending code somewhere in your program, i.e. in the Opening event or in the Pressed event of a PushButton. If you run this in the debugger you’ll notice that the app just quits, along with our debugger. Since our debugger has failed us here, let’s try Microsoft’s WinDbg and see if we can get any more information from it.
WinDbg
If you don’t already have WinDbg installed, you can now download this from the Microsoft Store:
https://docs.microsoft.com/en-us/windows-hardware/drivers/debugger/debugger-download-tools
For many Windows developers this is a great (and free) addition to help you track down those annoying crashes. To use this, build the Xojo app with the offending code. Run WinDbg and point it to the executable to launch. Once the process is loaded in WinDbg, hit their Go button to cause the crash.
With the app crashed, you can see the most recent stack trace where some of the last functions that were called before it crashed. This is what the stack trace looks like when no PDB exists.
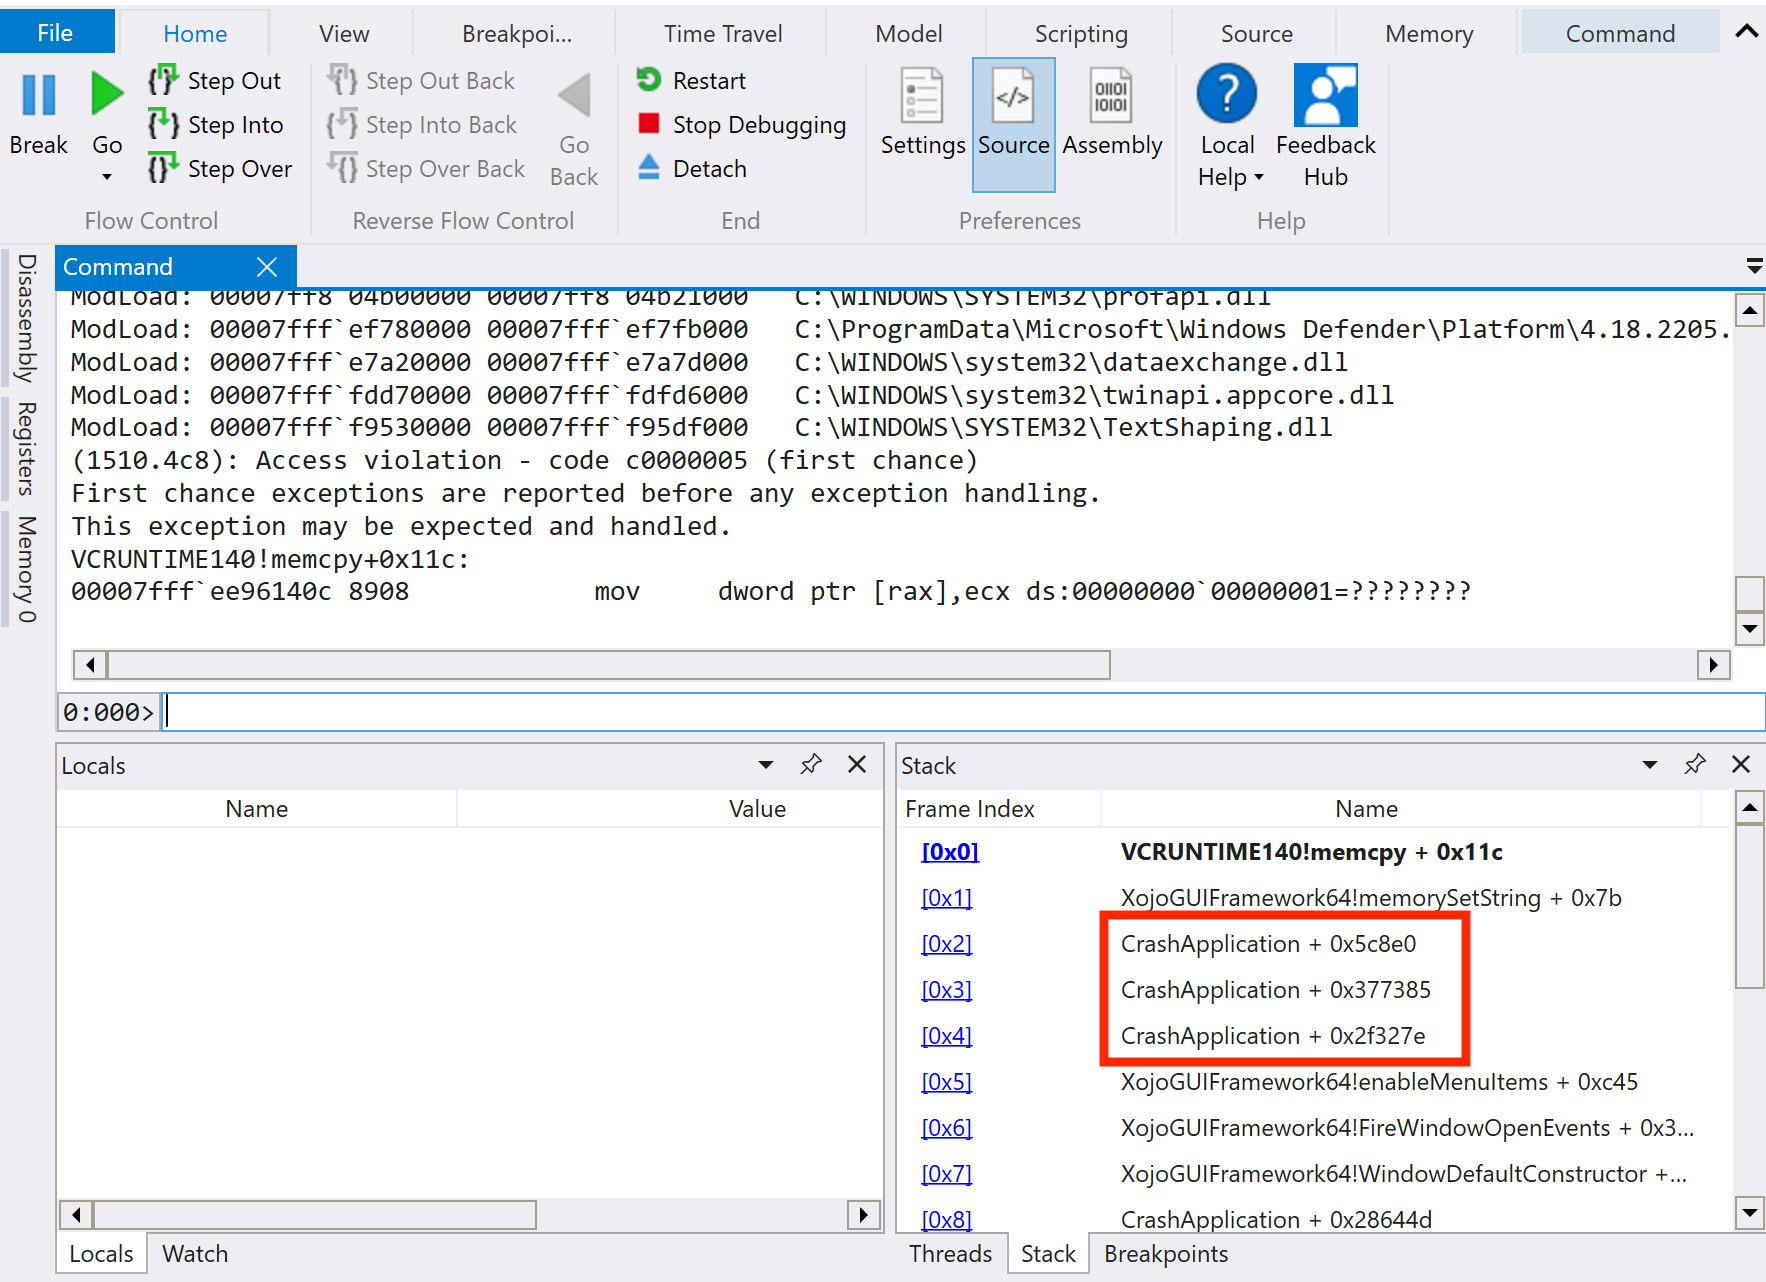
Since the debugger doesn’t have the information it needs to map the address to a particular function, it’ll just report this random address which isn’t very helpful.
Generate the PDB File
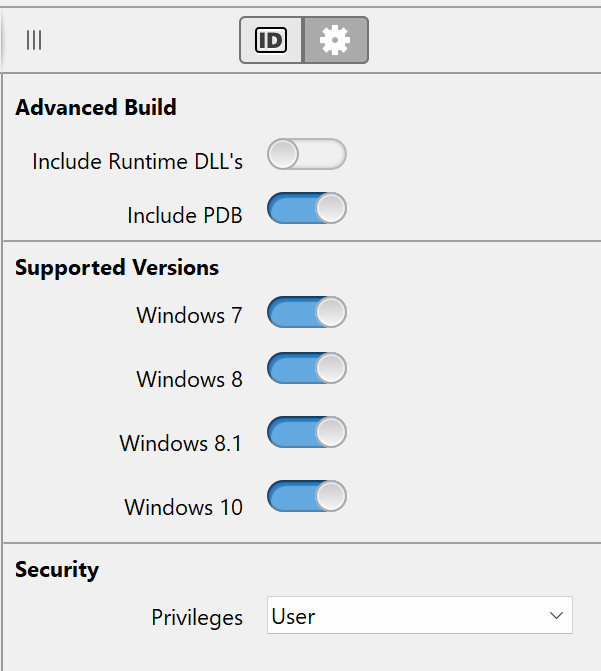
Now build the app again but this time generate the PDB file. This option can be found in the Advanced build settings in Xojo 2022r2 and later.
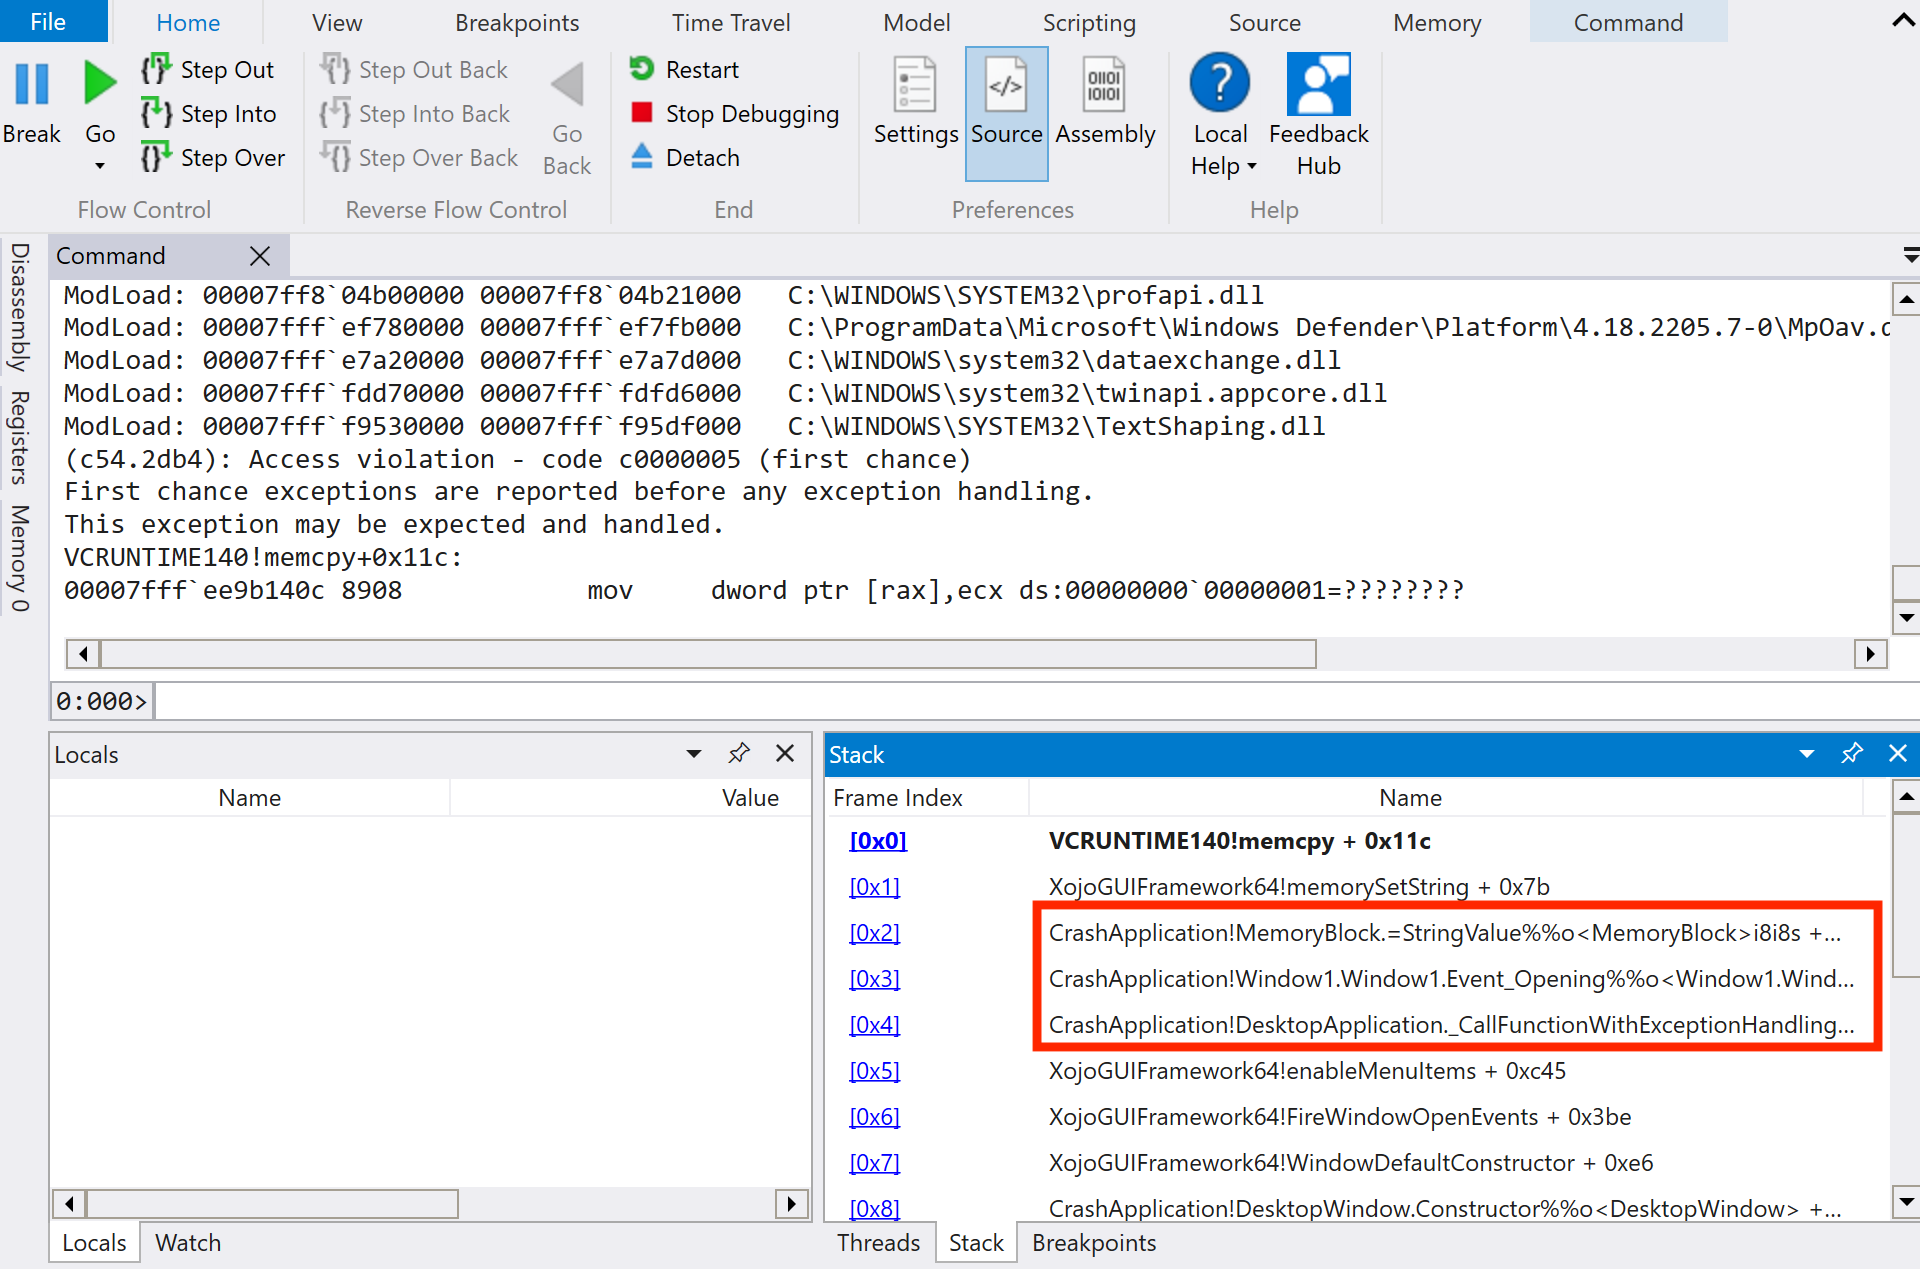
Run the app again under WinDbg. When you cause the app to crash again, WinDbg will look for a PDB file (note: it can be tuned to look in several different places, but by default it will look at the same directory as the executable). This time when the app crashes, you should get a more readable stack trace.
PDBs in the Real World
While the scenario that we just went through isn’t the most common one in the real world, it should provide you an idea of how a PDB file can help with debugging. In a real world scenario, you as the developer, will likely store PDBs internally, maybe on a server somewhere. Each time you build your app for deployment (i.e. when your app is released to the public) you would keep this PDB somewhere. Whenever your clients/users experience crashes in your app, you can ask them to send over a minidump. The same principle applies to executables and minidumps, just load it up and run it. However, the only difference is that the minidump may need more help in locating the right PDB file.
For more information on this topic please refer to: https://docs.microsoft.com/en-us/windows-hardware/drivers/debugger/symbol-path
William Yu grew up in Canada learning to program BASIC on a Vic-20. He is Xojo’s resident Windows and Linux engineer, among his many other skills. Some may say he has joined the dark side here in the USA, but he will always be a Canadian at heart.