
I was recently asked if there was a way to use Xojo Canvas Graphics to draw using the math X-Y coordinate system. First a little background. In Xojo (along with Java, .NET and many other languages), graphics are drawn where (0,0) is at the top left, X increases to the right and Y increases down. Other languages or APIs (Cocoa, for example) use a system where (0,0) is at the bottom left, X increases to the right and Y increases up.
In mathematics, (0,0) is typically at the center with positive X being to right, negative X to the left. Positive Y is up and negative Y is down.
This means if you are trying to draw the graphs of some standard math functions you have to do some translating. With Xojo you can use the Graphics.Translate() function to relocate the origin point. This makes it easy to move (0,0) from the top left to the center with code like this in the Paint event:
g.Translate(g.Width / 2, g.Height / 2)Switching the Y from going from the top down to the bottom up is just a matter of negating it. With a translated origin, this would draw a line above the baseline:
g.DrawLine(1, -2, 1, -2)I thought it might be interesting to try and wrap this up in some subclasses to make it a little more automatic, work with the smaller scale typically used for these type of graphs and even graph some functions.
The result is a project, MathGraph, which can draw some shapes on the graph and also graph simple functions that work with x.
Here’s an example of a graph for the cubic polynomial function y = x^3:
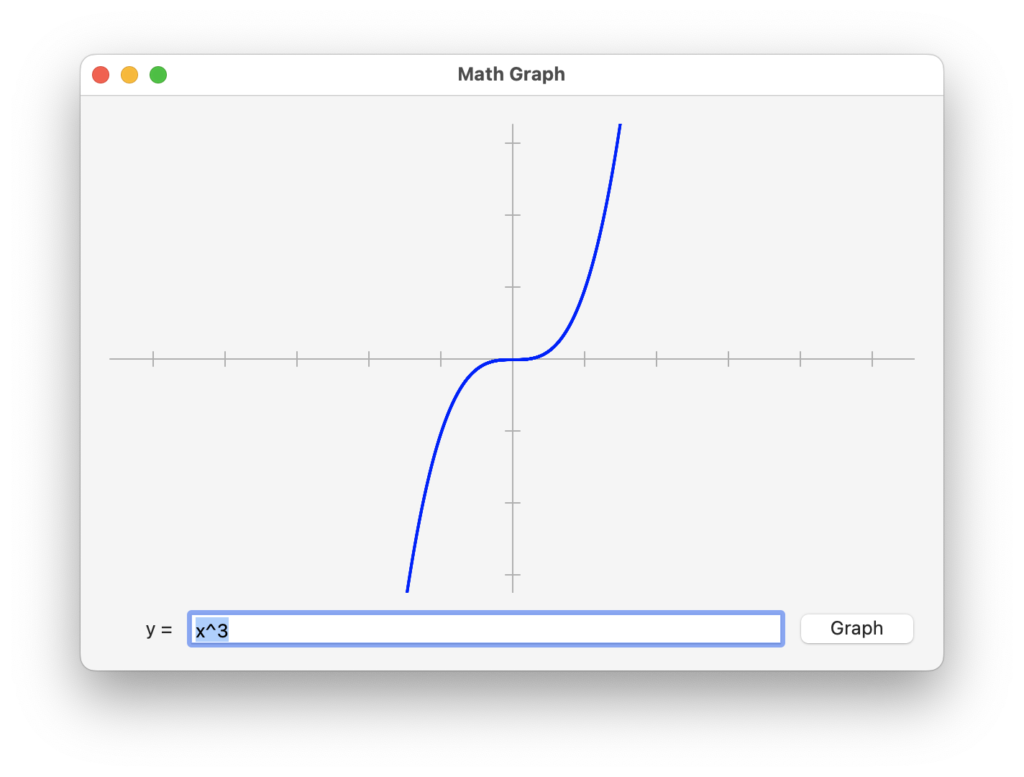
Keep in mind that this only solves for x.
Other functions you might want to try:
- quadratic polynomial: x^2
- line: x
- absolute value: abs(x)
- reciprocal of x: 1/x
- reciprocal of x2: 1/x^2
- square root: sqrt(x)
- exponential: exp(x)
- logarithmic: log(x)
- sin wave: sin(x)
- sin(x)/cos(x)
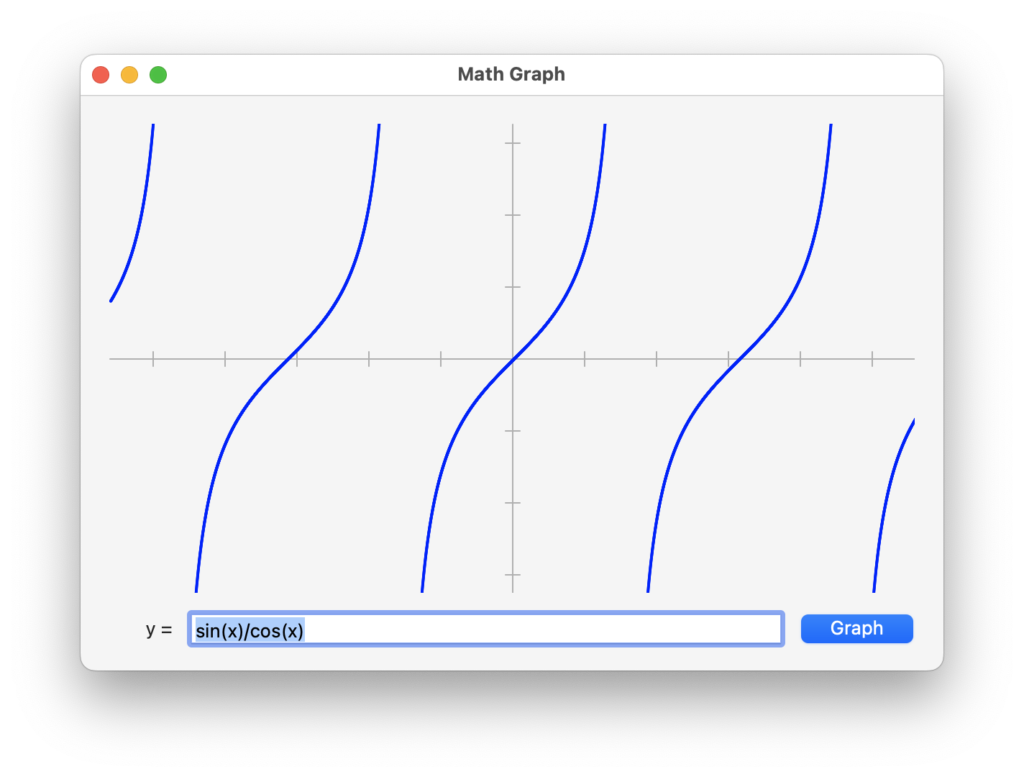
Try multiplying and dividing some of the above in combination. You can use any valid Xojo math expression and any of the math functions. If there is an error in your function, then the error message is shown in the graph itself.
There are also some built in functions to draw text, rectangles, ovals and plot points that you can use in the Paint event handler.
This is provided as a Canvas subclass, called MathCanvas. It has companion classes MathGraphics and Grapher. MathGraphics is used to draw using math coordinates. Grapher is a subclass of XojoScript and is what processes the function for graphing (it is based on the Evaluator example project included with Xojo).
Download the MathGraph project to try it for yourself.
Paul learned to program in BASIC at age 13 and has programmed in more languages than he remembers, with Xojo being an obvious favorite. When not working on Xojo, you can find him talking about retrocomputing at Goto 10 and on Mastodon @lefebvre@hachyderm.io.